Interactive Sales Dashboard Using Excel (Pivot Tables & KPIs)
تفاصيل العمل
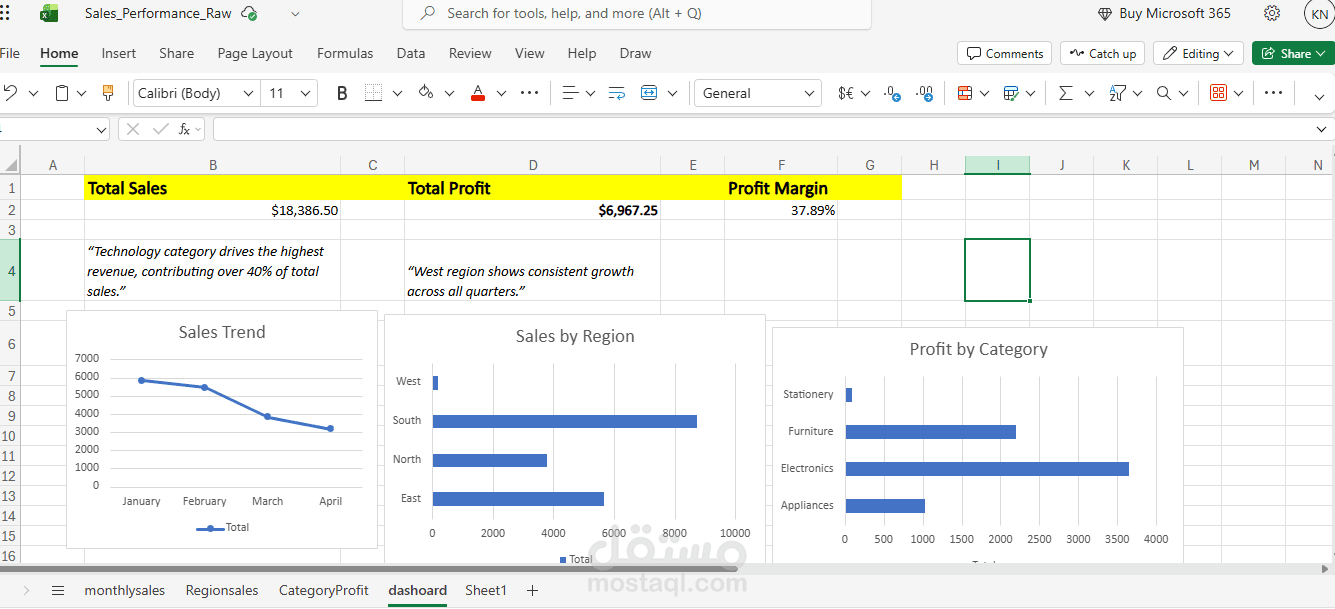
This project presents an interactive sales dashboard created using Microsoft Excel. It analyzes total sales, total profit, and profit margin, with dynamic filtering by region and product category. The dashboard uses Pivot Tables, Pivot Charts, and automated calculations to deliver real-time insights and clear data visualizations, demonstrating strong analytical and business-focused data analysis skills.