Amazon Product Reviews Dashboard Project
تفاصيل العمل
Amazon Product Reviews Dashboard Project
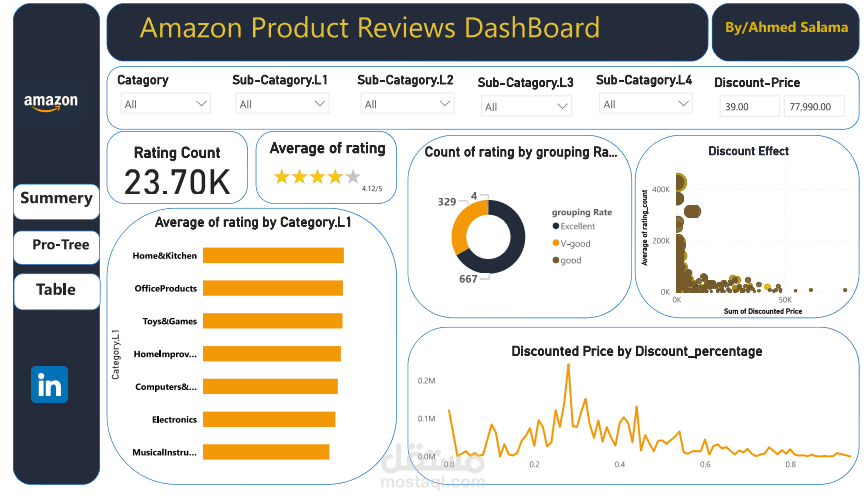
I’m excited to share my latest project: an Amazon Product Reviews Dashboard designed to analyze and visualize key metrics from product reviews. This dashboard provides actionable insights into customer ratings, discounts, and category performance, helping businesses make data-driven decisions.
Key Features & Insights:
Rating Analysis
Total ratings: 23.7K
Average rating: 4.16 (out of 5)
Rating distribution: Excellent (200K), Very Good, Good, and OK categories.
Category Performance
Top-performing categories by average rating:
Home & Kitchen (4.34)
Office Products (4.31)
Toys & Games (4.30)
Detailed sub-category breakdowns (e.g., Craft Materials: 4.34, Painting Materials: 4.45).
Discount Impact
Discount price range: $39 to $77,990
Visualized correlation between discount percentages and pricing.
Interactive Filters
Users can filter by:
Category (L1 to L4)
Discount price ranges
Product hierarchies (e.g., Home & Kitchen → Craft Materials → Painting Materials → Paints).
Visualizations
Bar charts for rating distributions.
Tree maps for category hierarchies.
Discount vs. Price trends to identify pricing strategies.
Tools & Skills Demonstrated:
Data Analysis: Aggregating ratings, discounts, and category trends.
Dashboard Design: Interactive filters and visual storytelling.
Business Insight: Identifying high-performing categories and discount effects.
This project showcases my ability to transform raw data into meaningful insights. Whether you’re an e-commerce professional or a data enthusiast, I’d love to hear your thoughts!
Link of project and dataset : https://lnkd.in/ePBs6vwq