Emergency Room
تفاصيل العمل

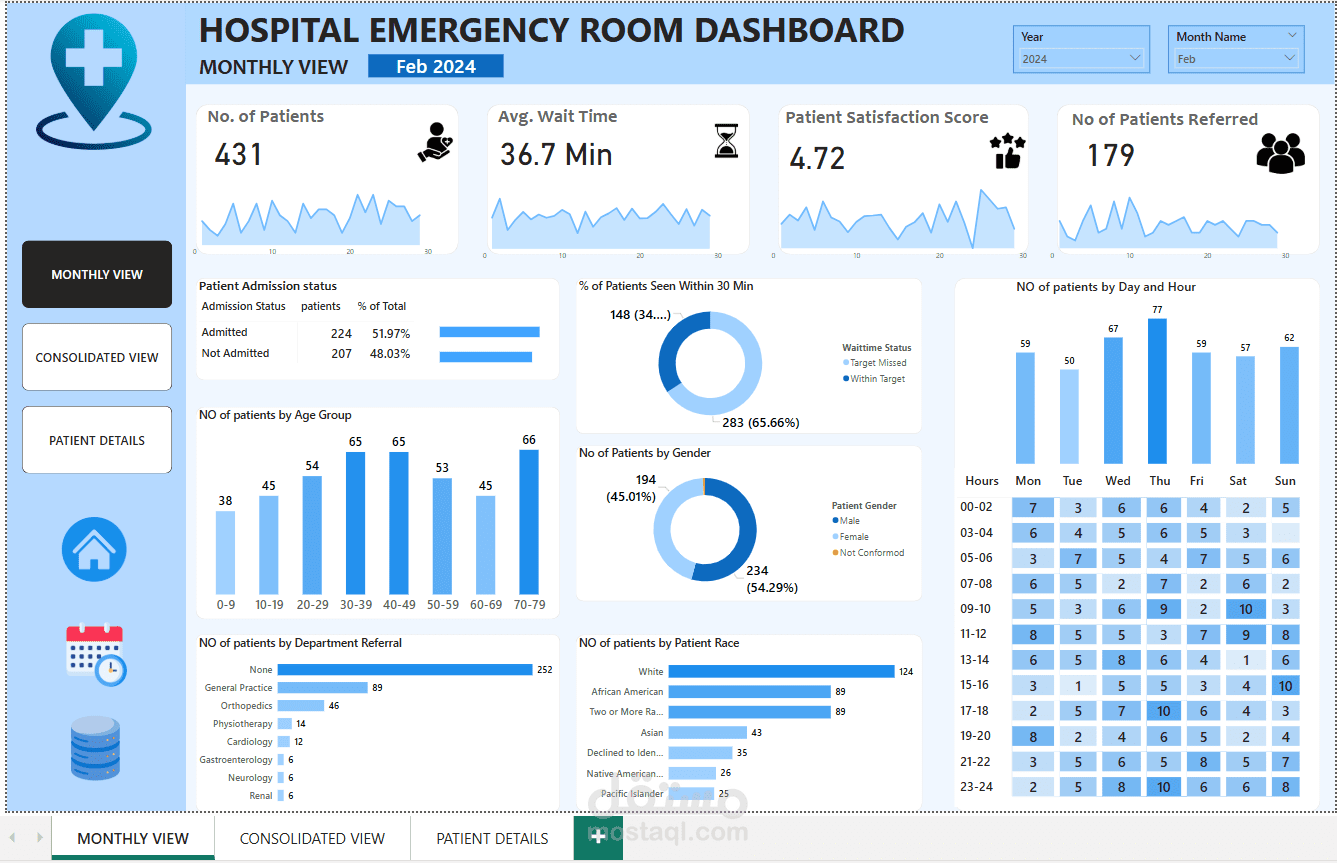
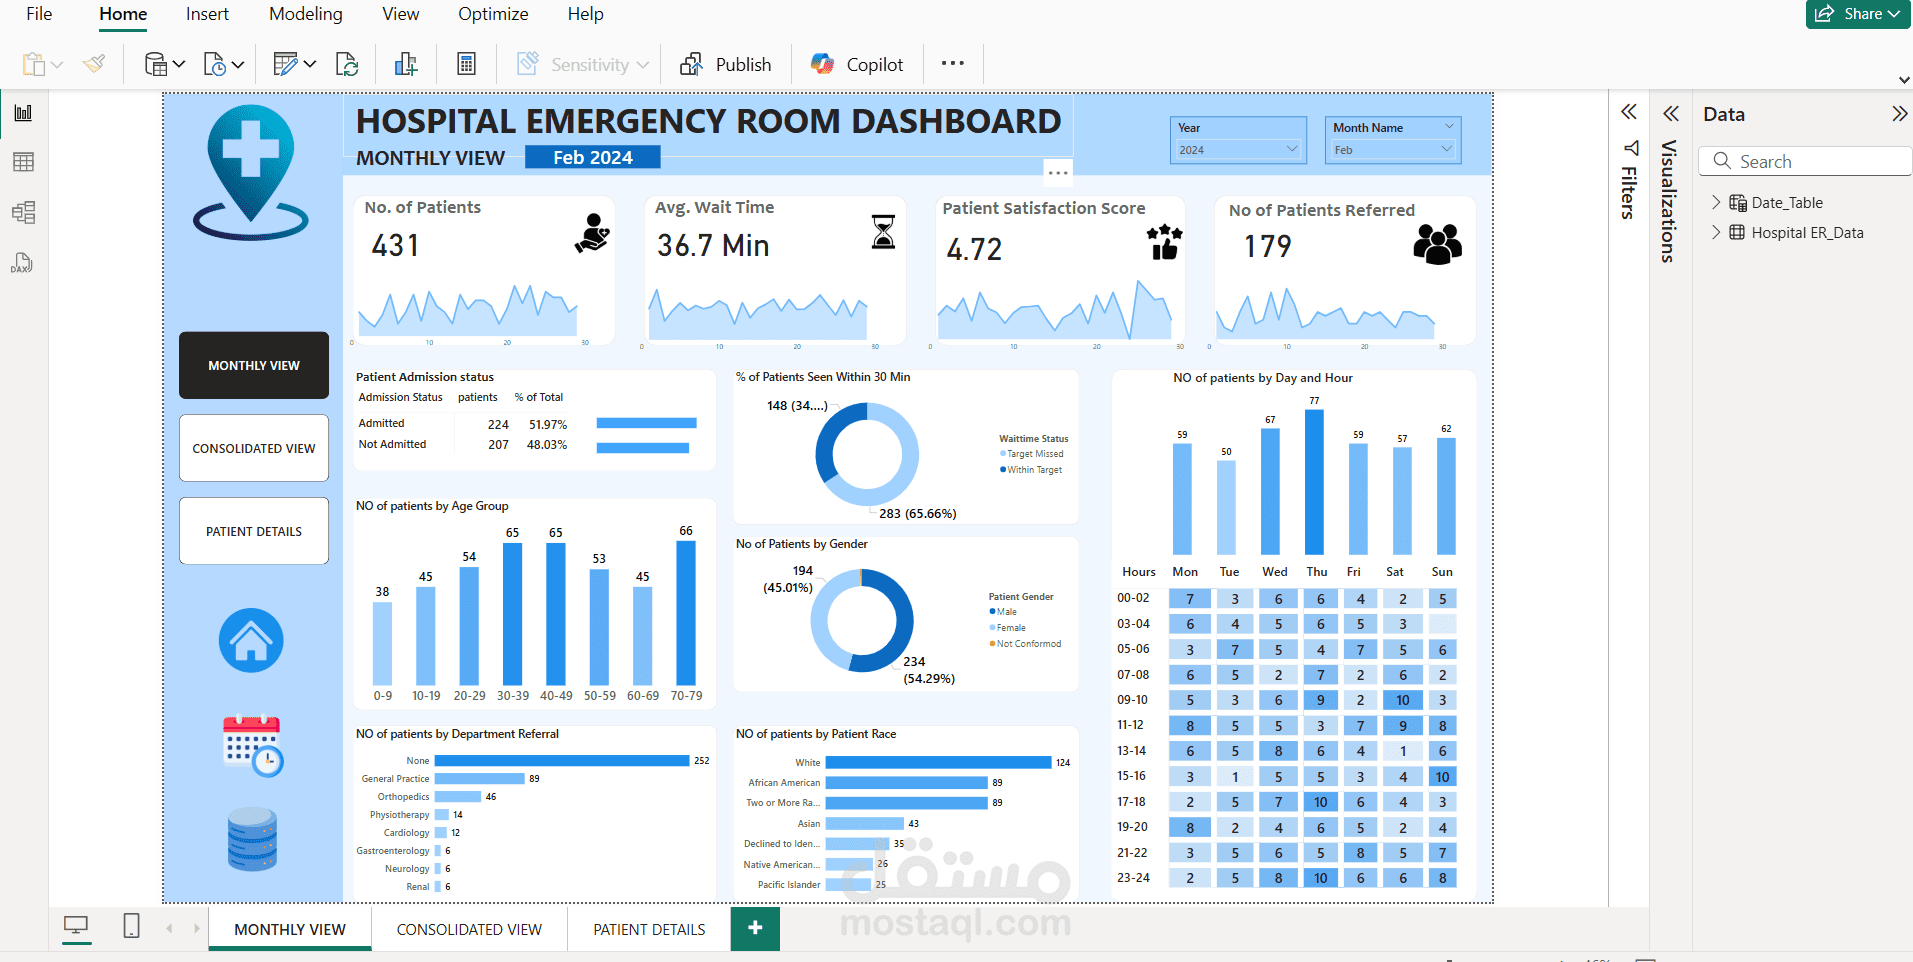
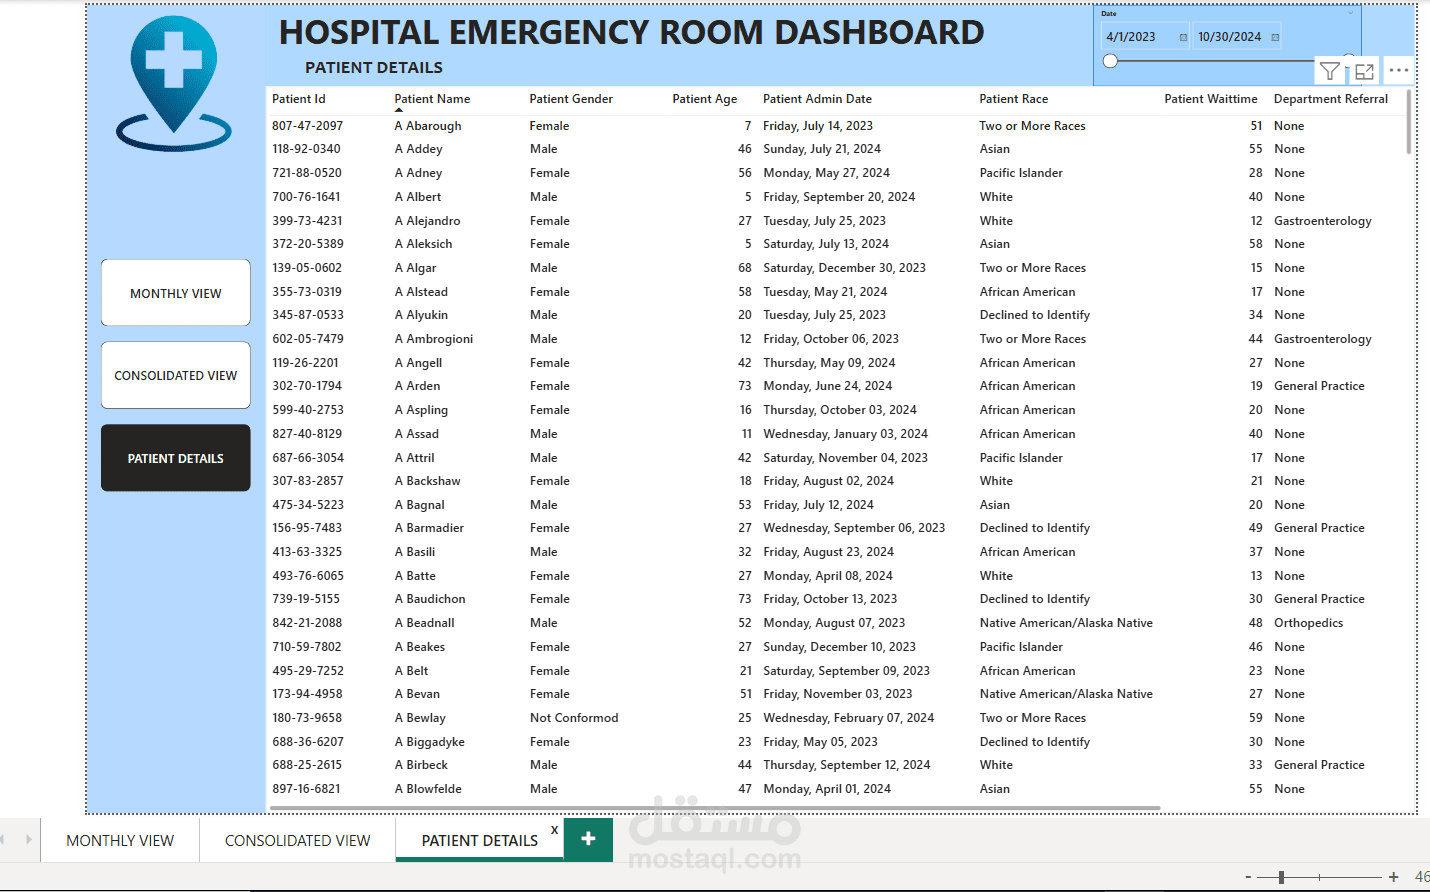
Project: Emergency Room Performance Analysis Dashboard
Developed an interactive Power BI dashboard to analyze key emergency room (ER) metrics and improve hospital operations.
Key Findings:
Peak hours identified (4–6 PM), linked to longer wait times
54% of patients are not transferred to other departments
Resource optimization recommendations provided
Need for more staff in high-demand departments
Better scheduling required during peak hours
Metrics Analyzed:
Admission & rejection rates
Patient distribution by age & gender
Waiting time & average service duration
Staff performance during peak hours
Tools Used:
Power BI for dashboards & visualizations
Power Query for data transformation
SQL & Excel for data processing
Statistical analysis for insight generation