Adventure Works Sales Analysis Dashboard
تفاصيل العمل
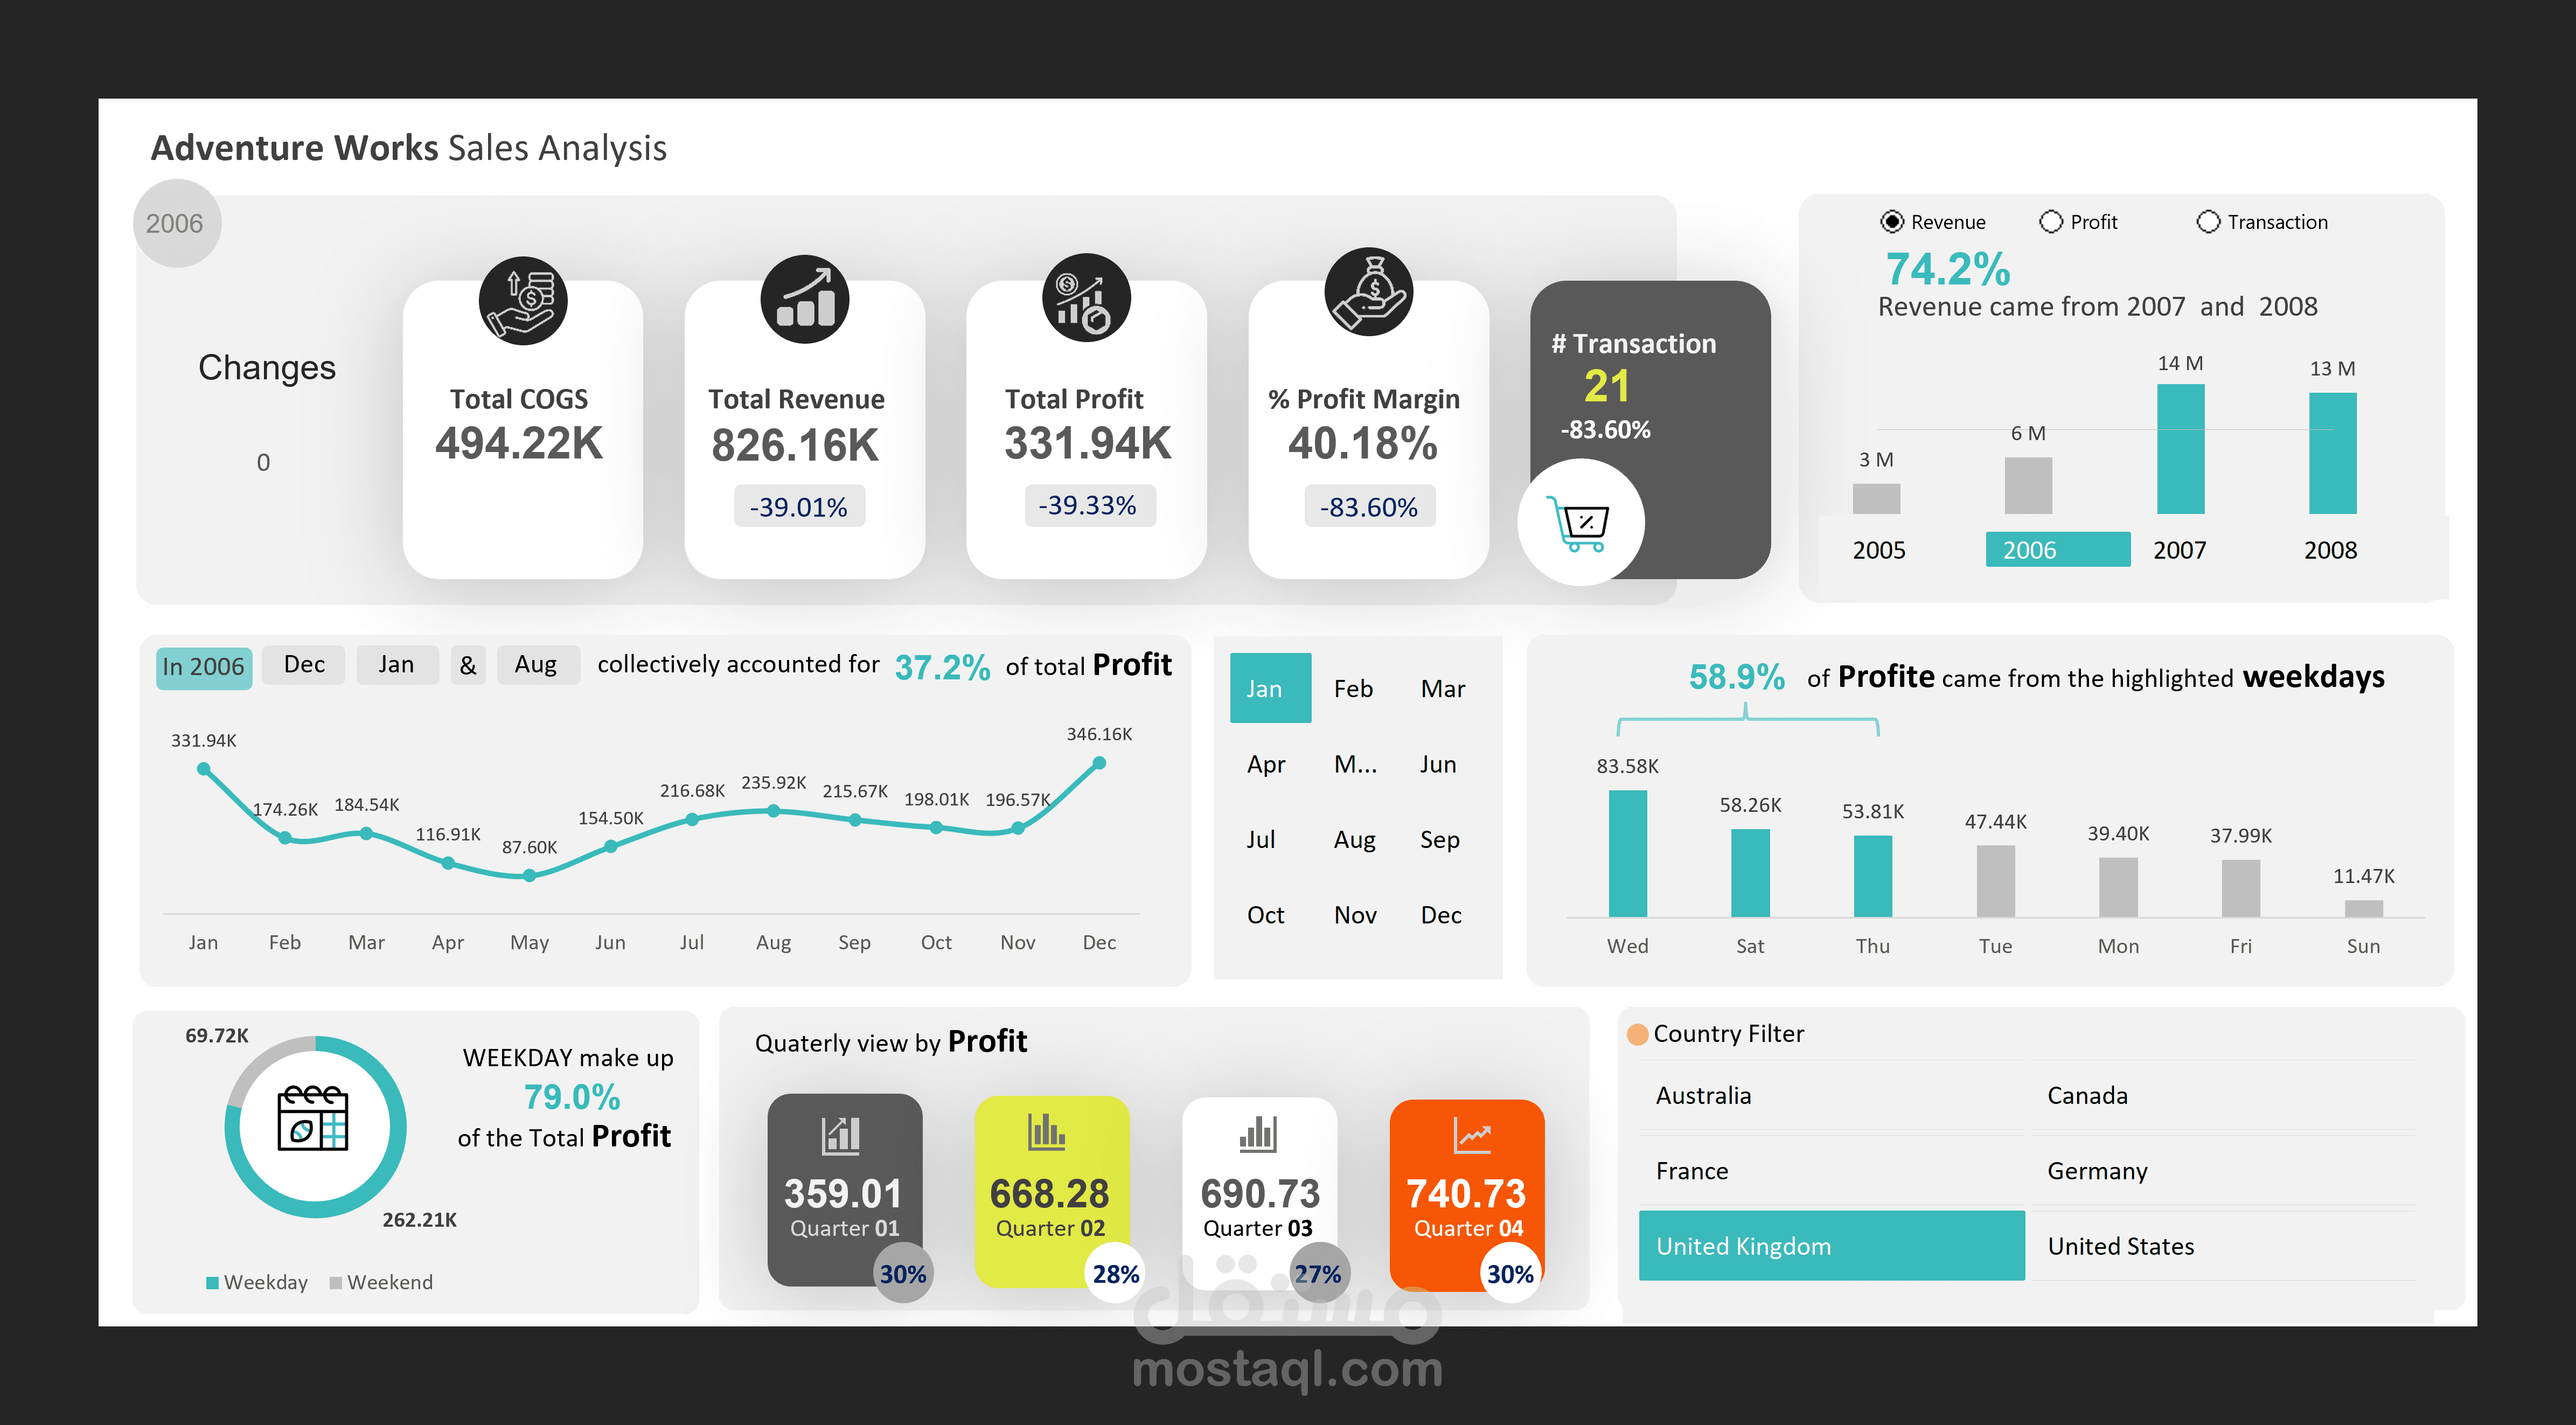
This dashboard provides a comprehensive analysis of sales performance for Adventure Works. It was created using Power BI to visualize key business metrics and trends in an interactive and dynamic way.
Key Insights:
Total Revenue, Profit, and COGS are displayed with year-over-year change percentages.
Profit Margin and Number of Transactions indicators highlight performance efficiency.
Trend analysis shows monthly profit fluctuations throughout 2006.
Revenue breakdown by year (2005–2008) helps identify growth periods.
Profit distribution by weekday vs. weekend provides insights into sales patterns.
Quarterly profit comparison visualizes seasonal performance.
Country filter enables analysis by region for detailed decision-making.
Tools Used:
Power BI
Excel (for data cleaning and preparation)