LinkedIn Job Search Dashboard
تفاصيل العمل
My Role
Cleaned and transformed raw job data using both Python (Pandas) and Power BI (Power Query).
Created calculated columns and measures using DAX in Power BI.
Built an interactive dashboard with slicers, charts, and KPIs in Power BI.
Developed visualizations and performed exploratory data analysis (EDA) in a Google Colab notebook.
Interpreted insights to support decision-making for job seekers and recruiters.
Data Preparation & Cleaning
Power BI:
Job Categorization: Created a new column job classifying titles into 5 categories: Data Analyst, Data Engineer, Data Scientist, Machine Learning & AI, and Other.
City to Country Mapping: Extracted and cleaned city data into a new country column.
Salary Extraction: Parsed salary information from the description column into a new salary column.
Custom DAX Measures: Created KPIs like total jobs, average salary, job frequency, and salary range by role.
Python (Colab):
Used Pandas for data cleaning and transformation.
Visualized job data using Matplotlib and Seaborn.
Focused on similar tasks: cleaning description, creating job and country columns, and visualizing job and salary distributions.
View the Colab Notebook:
Google Colab - LinkedIn Job Analysis
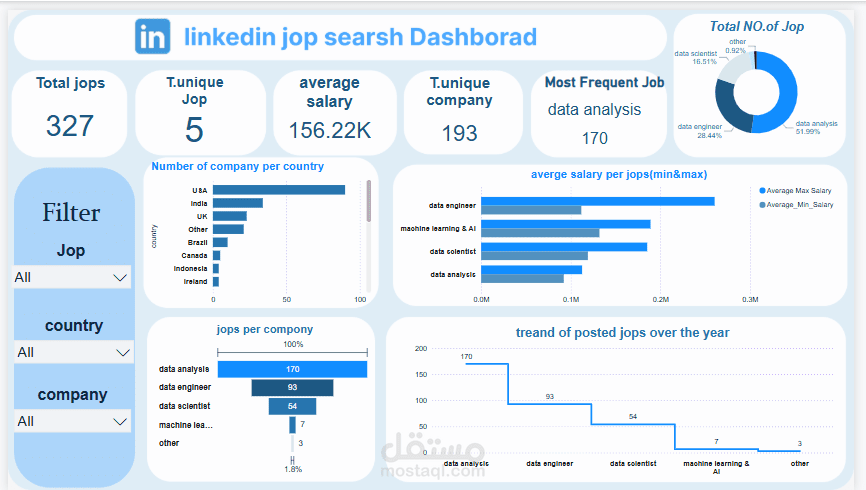
Key Metrics
Total Jobs: 327
Unique Job Titles: 5
Average Salary: 156.22K
Unique Hiring Companies: 193
Most Frequent Job Title: Data Analyst (170 postings)
Key Insights
High Market Demand:
Data Analyst jobs make up over 51% of listings.
Top Hiring Regions:
USA, India, and UK dominate the job market.
Salary Insights:
Data Engineers earn the highest salaries.
AI/ML roles are highly compensated.
Trend Analysis:
Most jobs were posted earlier in the year, showing a potential seasonality in hiring.
? Recommendations & Actions
Job Seekers:
Focus on tools like SQL, Python, and Power BI.
Apply to companies in high-posting countries.
Recruiters:
Benchmark salaries, especially for engineering and AI roles.
Educators:
Enhance curriculums focused on high-demand skills.
Tools & Technologies
Power BI: Visualization, DAX, Power Query
Google Colab (Python): Pandas, Matplotlib, Seaborn
Excel/CSV: Source Data
Project Files
LinkedIn_Job_Dashboard.pbix – Power BI dashboard
linkedin_job_analysis.ipynb – Colab notebook (link above)
Cleaned dataset with new columns: job, country, salary """