sales overview
تفاصيل العمل
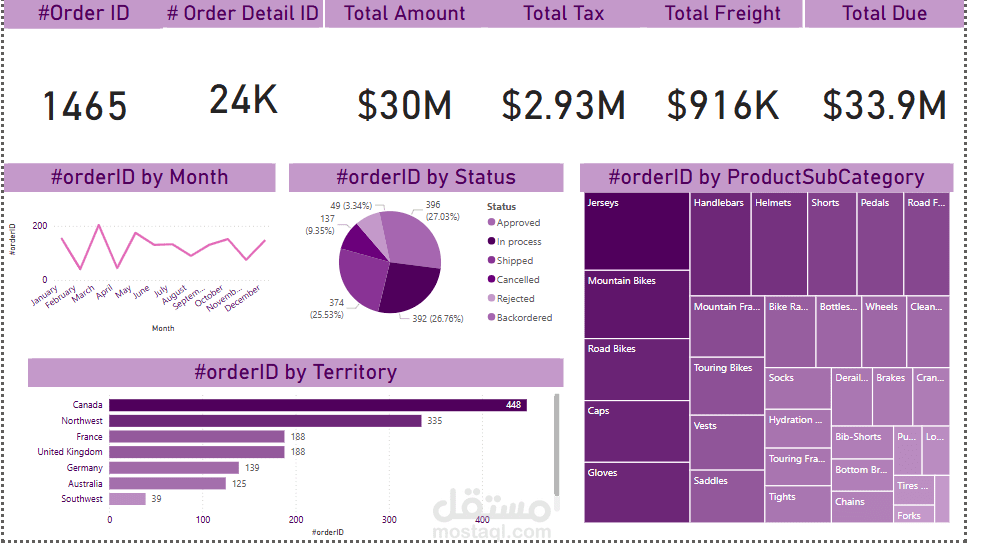
In this project, I worked on analyzing and visualizing a comprehensive sales dataset containing over 24,000 transaction records. Using tools like Excel/Power BI, I cleaned and organized the data, then developed an interactive dashboard showcasing key metrics such as total revenue, tax, freight, and order counts. I segmented the data by order status, product subcategories, and territories to identify top-performing areas and products. Additionally, I created trend visualizations to display monthly sales patterns and helped highlight actionable insights for decision-makers.