Sales Data Visualization
تفاصيل العمل
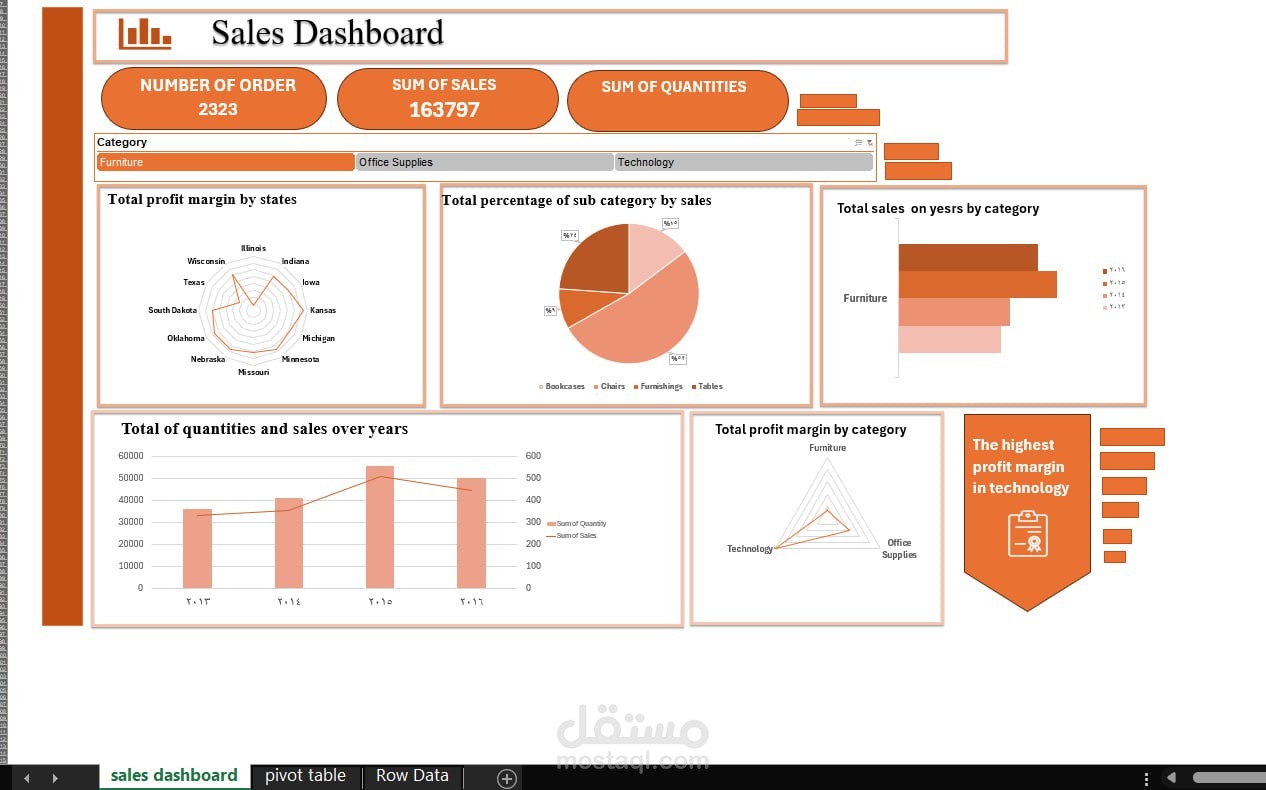
Project: Sales Data Visualization
Challenge: Displaying sales data effectively using Pivot Tables in Excel
Approach:
Organized and structured the data for better analysis
Optimized order display for clear insights
Applied an analytical approach to interpret and visualize data effectively