Employee Report
تفاصيل العمل
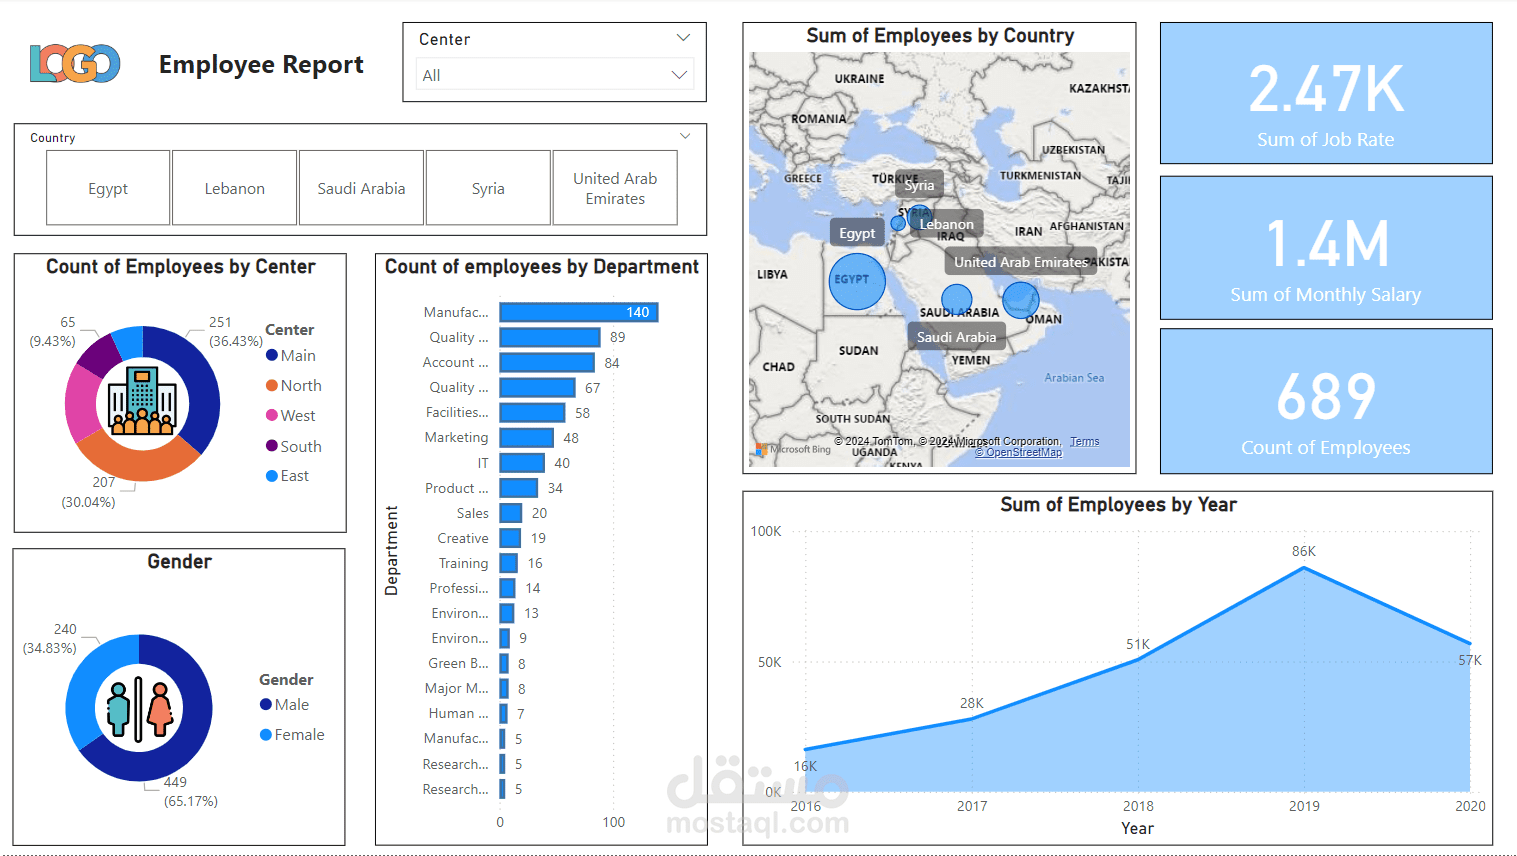

Employee Report Dashboard Workflow:
Preprocessing in Excel:
Import data, handle missing values (fill blanks with "Unknown" or averages), remove duplicates, and standardize formats.
Create calculated columns (e.g., categorize Job Rate, normalize salaries).
Split combined data (e.g., multiple countries) for better mapping in Power BI.
Dashboard in Power BI:
Import cleaned data and verify column types.
Create visuals: pie charts (employee count by Center, Gender), bar charts (employee count by Department), map (employees by country), area chart (employees by Year), and cards (key metrics).
Add slicers for interactivity (e.g., country filter).
Format and test the dashboard, then publish to Power BI Service for sharing.