Sales Analysis Project – Excel + Power BI
تفاصيل العمل

Sales Analysis Project – Excel + Power BI
In this project, I performed data preprocessing using Microsoft Excel and created an interactive dashboard using Power BI to analyze global sales performance.
What I Did:
Cleaned and prepared raw sales data using Excel (handling missing values, filtering, formatting)
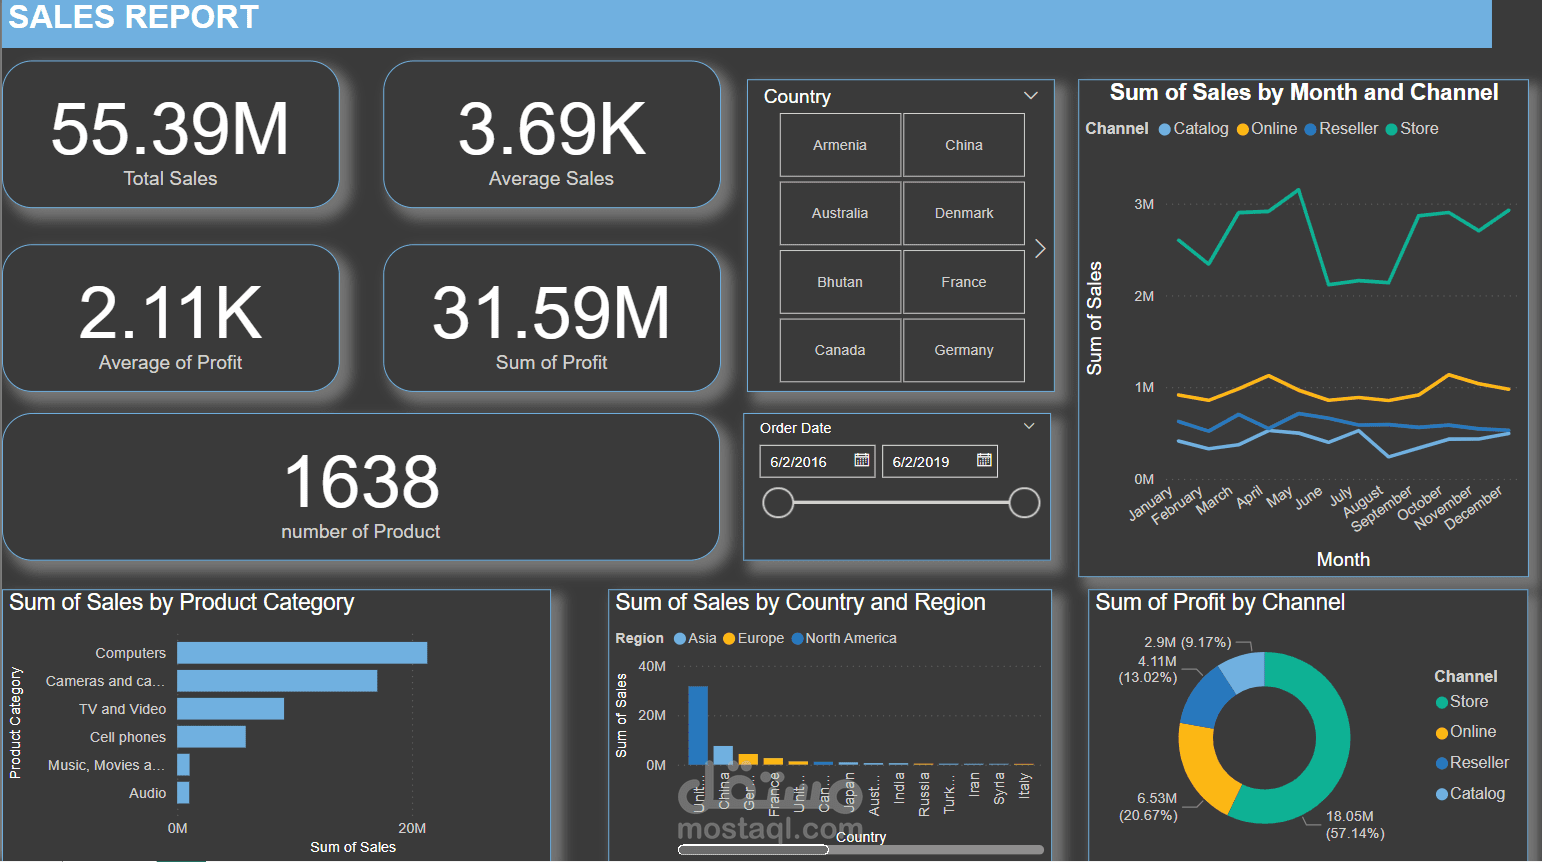
Built a professional Power BI dashboard to visualize:
Total and average sales & profits
Sales by product category and country
Monthly trends by sales channel
Profit distribution by channel
Interactive filters (by date and country)
Tools & Skills Used:
Microsoft Excel (data cleaning & preparation)
Power BI (visualization, KPIs, DAX, interactivity)
This project demonstrates my ability to manage data end-to-end — from cleaning raw data to creating interactive visual dashboards that support business decision-making.