Revenue & Margin Analysis
تفاصيل العمل
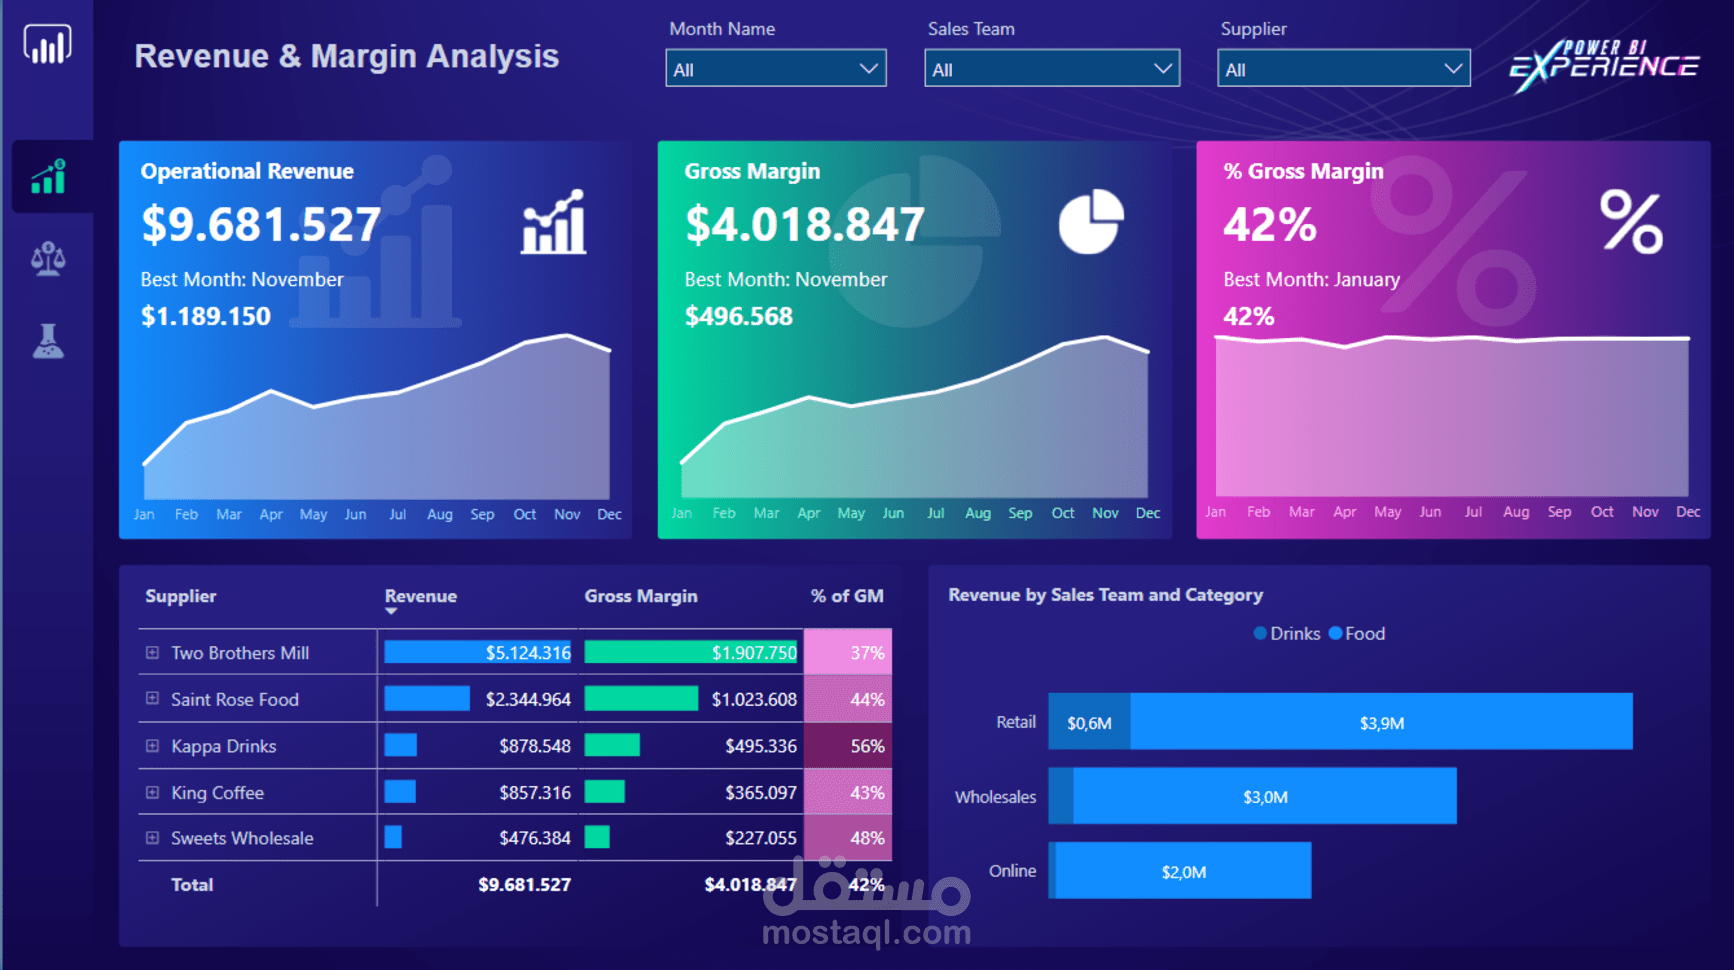
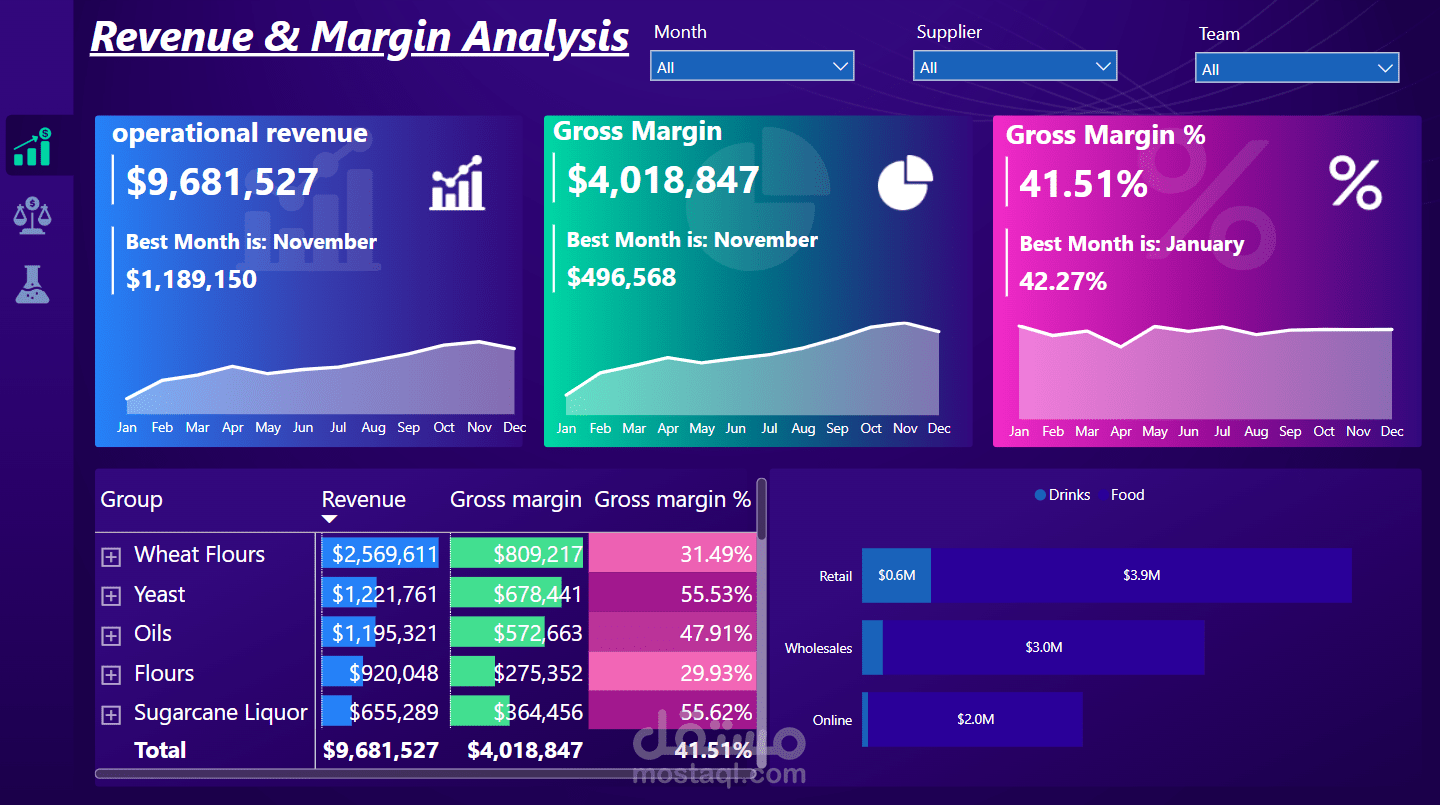
Revenue & Margin Analysis Dashboard – Built with Power BI
In this project, I designed a professional and interactive dashboard using Power BI to analyze and visualize revenue performance and gross margin for multiple suppliers and sales teams throughout the year.
Key Features:
Dynamic display of operational revenue, highlighting the best-performing month.
Detailed monthly gross margin analysis with clear visual trends.
Calculation of gross margin percentage and monitoring it over time.
Interactive supplier performance table showing revenue, gross margin, and GM%.
Bar chart showing revenue by sales team (Retail, Wholesales, Online), categorized by product type (Food & Drinks).
Slicer filters for Month, Supplier, and Sales Team to enable customized analysis.
Objective: To help management easily track supplier and sales performance and make data-driven decisions with clear and accurate visuals.
️ Tools Used:
Power BI
DAX
Clean and user-friendly visual design