Sales data
تفاصيل العمل
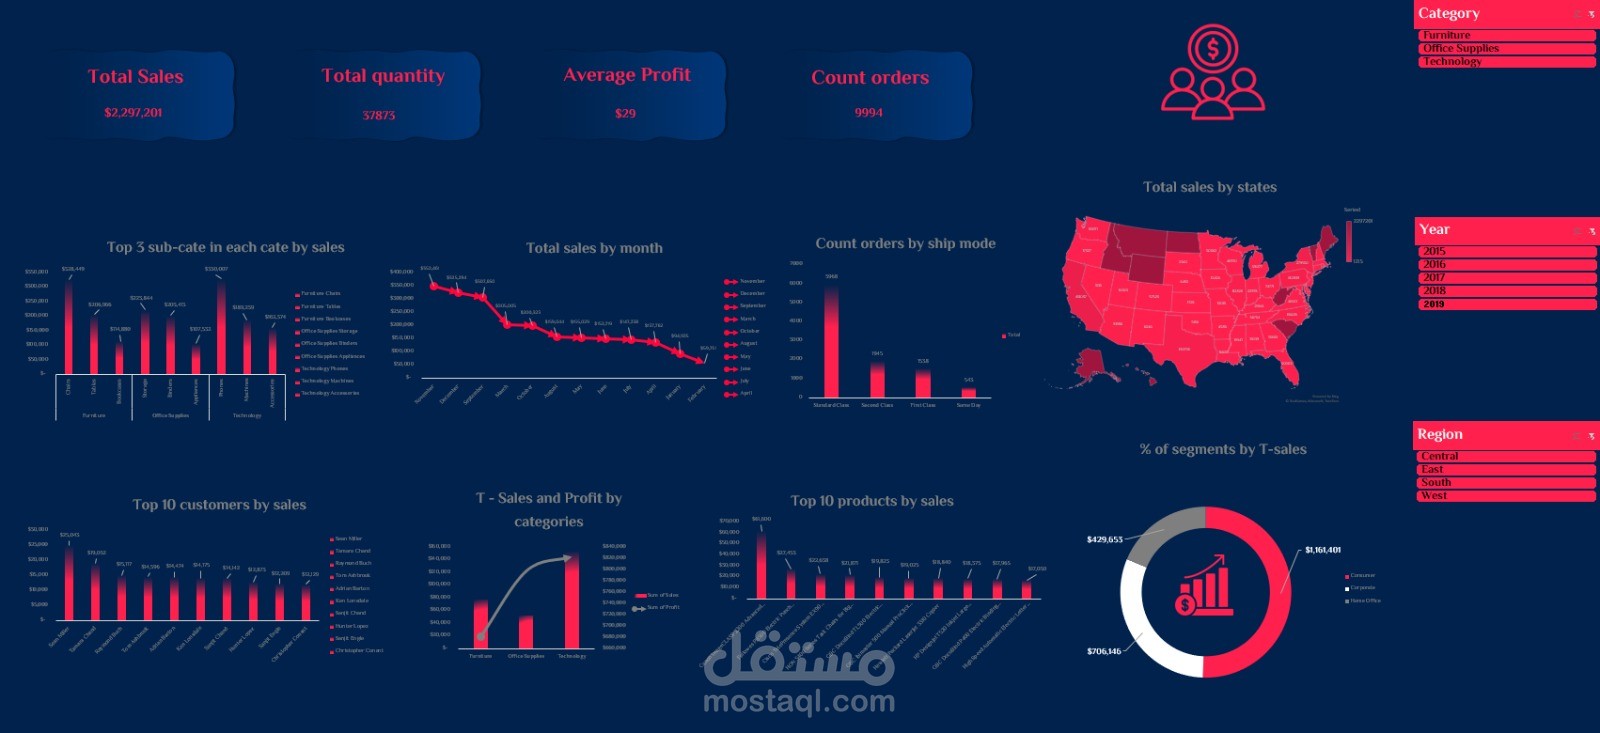
I'm excited to share my Final Project in Excel, where I designed a Sales Analysis Dashboard using Power Pivot to build a robust data model and extract valuable insights!
How I Built It?
Created a relational data model in Power Pivot, integrating multiple tables (Fact & Dimensions).
Established relationships between Orders, Customers, Products, Shipping, and Dates for efficient data analysis.
Generated interactive visuals to track key performance indicators (KPIs)
And power query for Data preparation ️
Key Metrics Tracked:
Total Sales : $158,105
Total Quantity Sold : 1,637
Average Profit per Sale : $13
Total Orders : 424
Dashboard Insights:
Top 3 sub-categories generating the highest revenue.
Monthly sales trends to monitor performance.
Order distribution by shipping mode for
logistics optimization.
Sales breakdown by states across the U.S.
Top 10 customers and products contributing to revenue.
Sales & Profit analysis by category and segment.