Home Dashboard Sales & product تحليل المبيعات بالتجزئة
تفاصيل العمل

لوحة معلومات ذكاء الأعمال المتكاملة لتحليل المبيعات بالتجزئة، تعرض بيانات مفصلة عن الإيرادات والمنتجات والعلامات التجارية والفئات في واجهة سهلة الاستخدام. تم تطوير هذه اللوحة باستخدام:
تنظيف البيانات وتحويلها باستخدام Power Query
تحليلات متقدمة باستخدام لغة DAX
تصور بيانات احترافي باستخدام Power BI
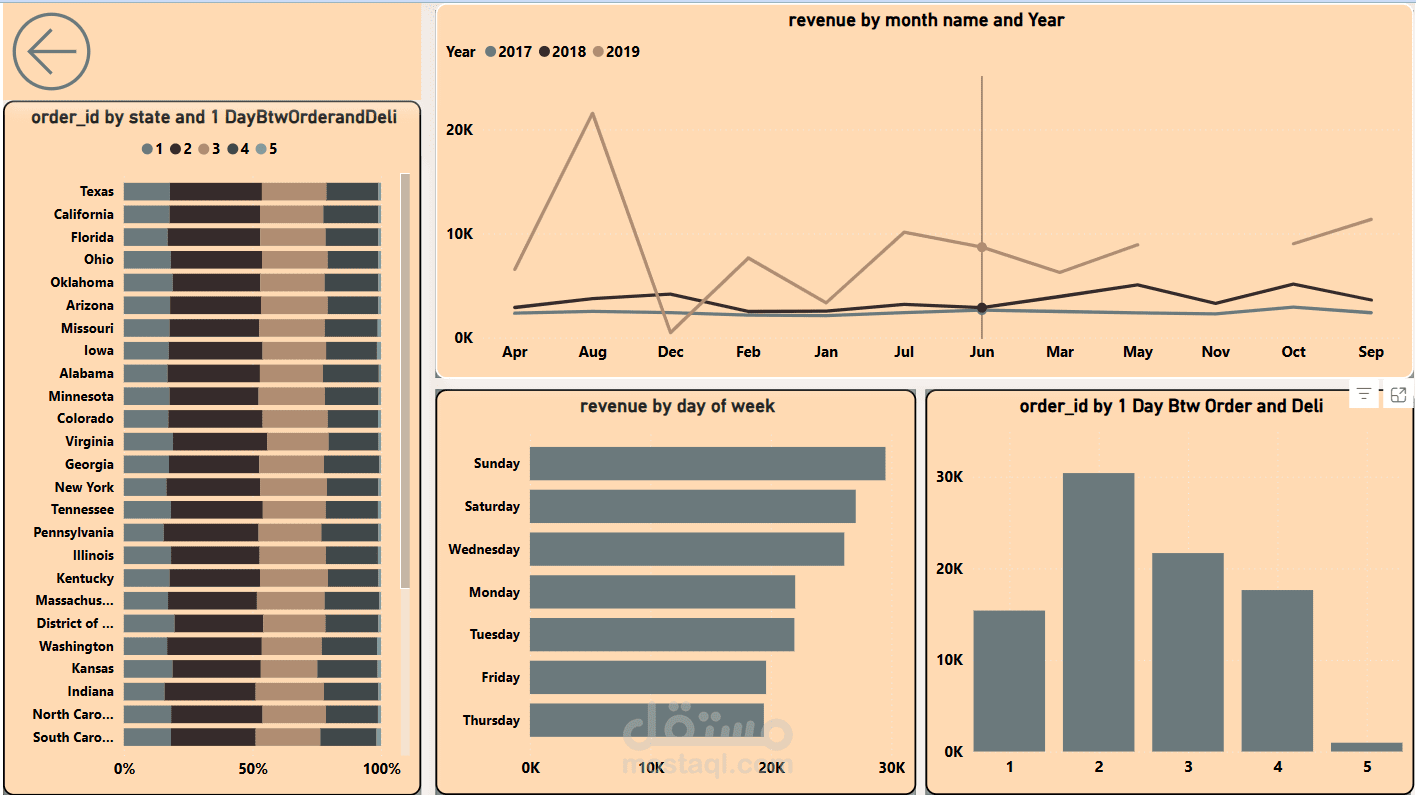
تحليل متعدد الأبعاد للمبيعات حسب المنتج والفئة والموقع والوقت
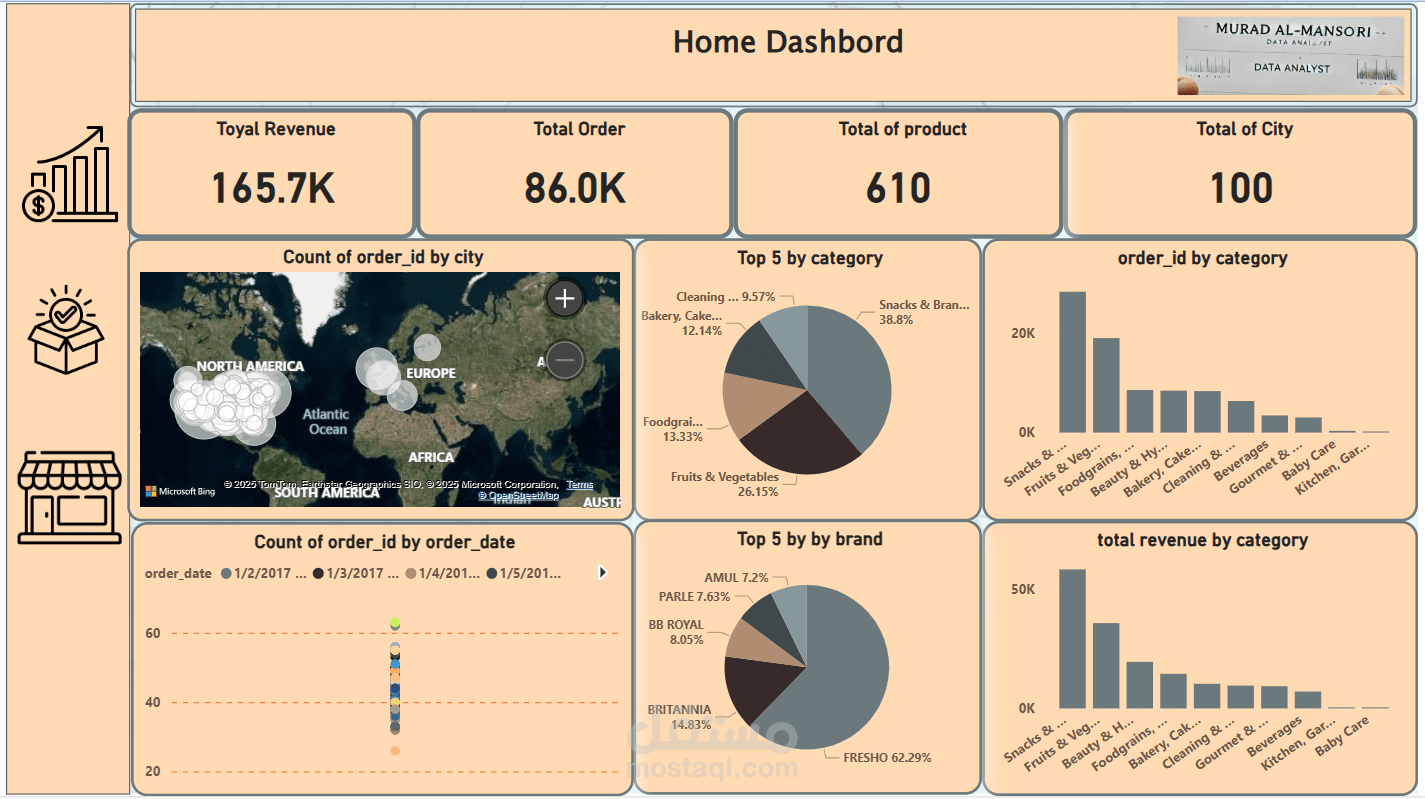
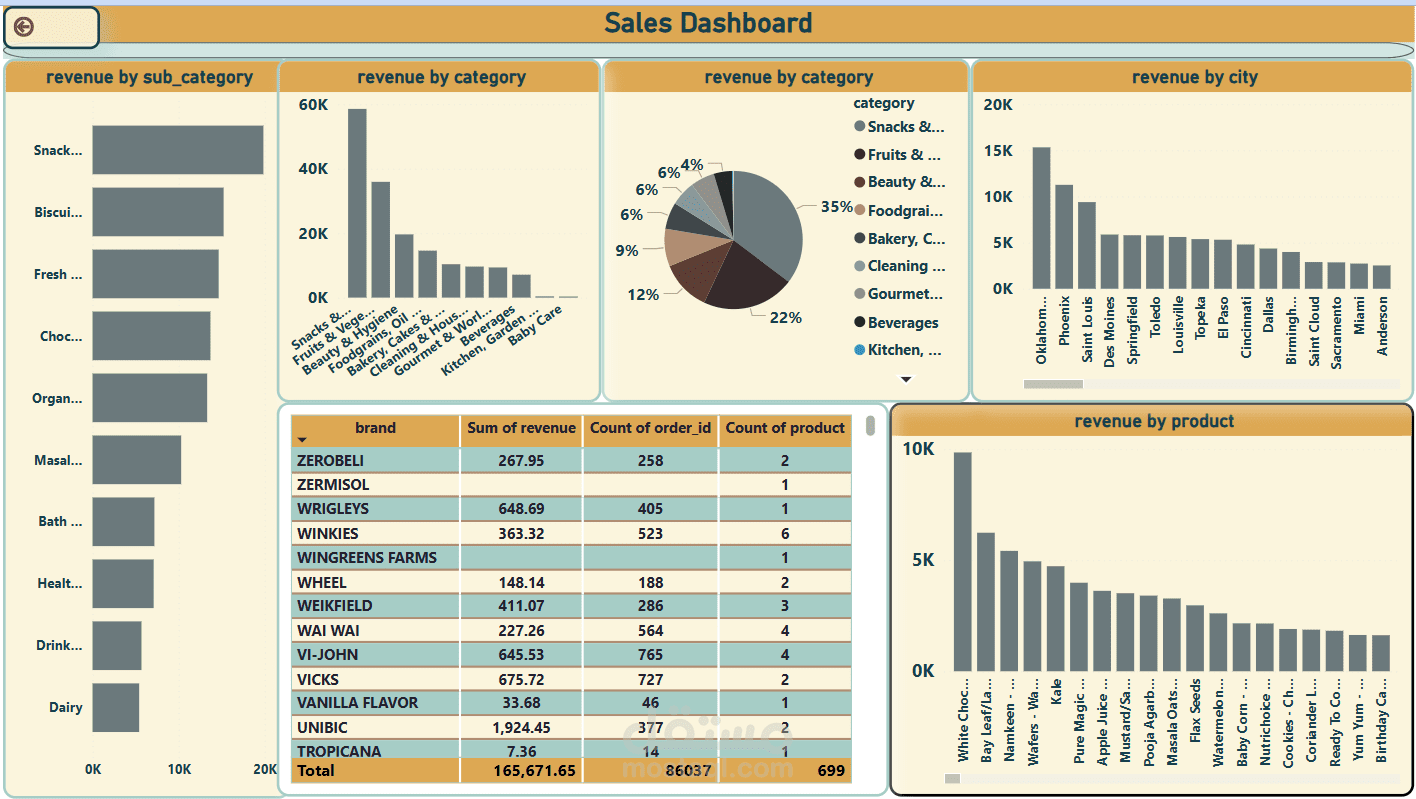
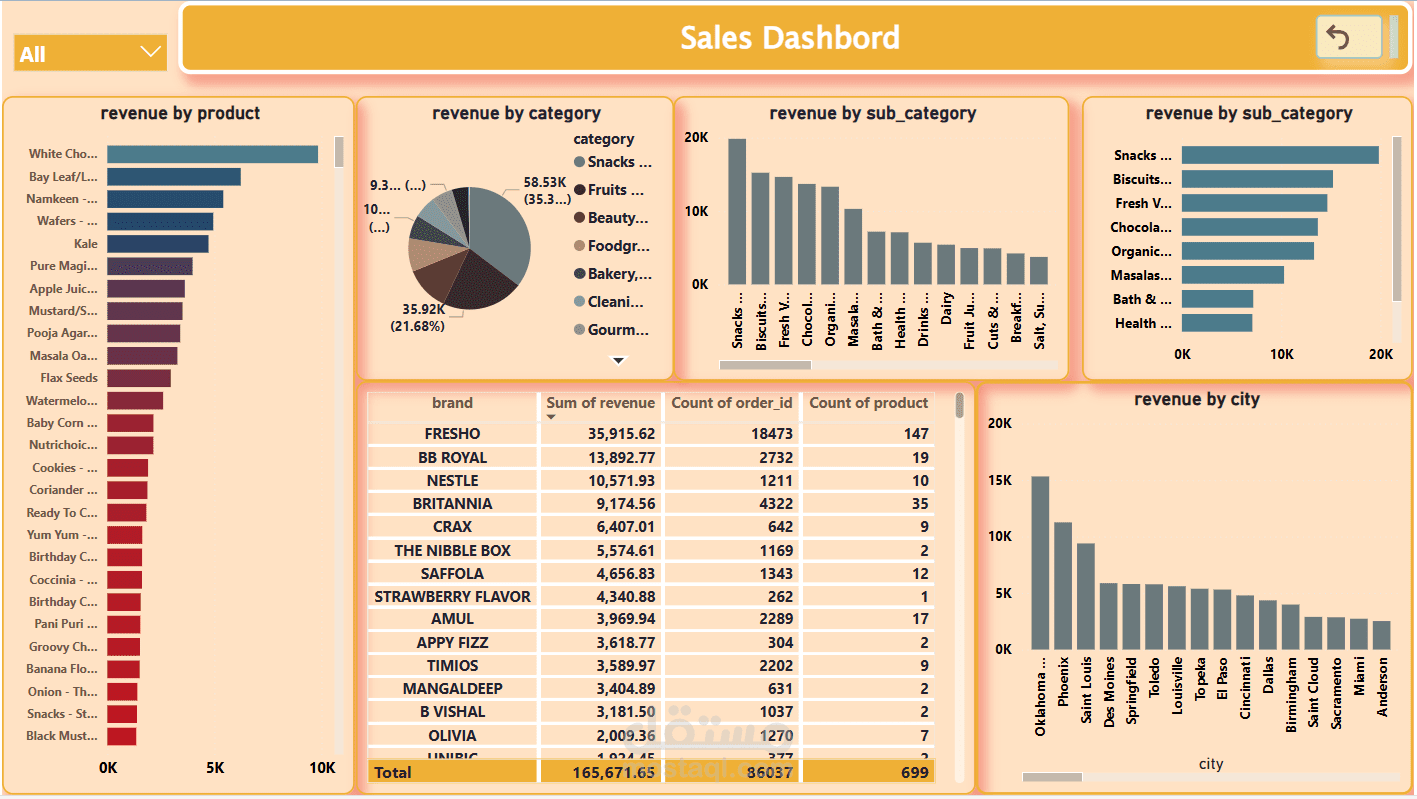
تعرض اللوحة مؤشرات الأداء الرئيسية مثل إجمالي الإيرادات (165.7 ألف) وعدد الطلبات (86 ألف) والتوزيع الجغرافي للمبيعات. تتضمن تحليلات متعمقة للإيرادات حسب الفئات والمنتجات، مع تسليط الضوء على أن فئة "Snacks & Brands" تمثل أعلى مصدر للإيرادات بنسبة 35%.
تتيح اللوحة رؤى قابلة للتنفيذ لاتخاذ قرارات تجارية مستنيرة، مثل تحسين المخزون، واستهداف الأسواق الجغرافية، وتخطيط العروض الترويجية بناءً على الاتجاهات الموسمية.
Comprehensive Business Intelligence Dashboard for retail sales analytics, showcasing detailed revenue, product, brand, and category data in an intuitive interface. This dashboard was developed using:
Data cleaning and transformation with Power Query
Advanced analytics using DAX language
Professional data visualization with Power BI
Multi-dimensional analysis of sales by product, category, location, and time
The dashboard displays key performance indicators such as total revenue ($165.7K), order count (86K), and geographical distribution of sales. It provides deep insights into revenue by categories and products, highlighting that "Snacks & Brands" represents the highest revenue source at 35%.
The dashboard enables actionable insights for informed business decisions, such as inventory optimization, geographic market targeting, and promotional planning based on seasonal trends.
Key Skills Demonstrated:
Data cleaning and transformation using Power Query
Advanced analytics with DAX
Data visualization expertise with Power BI
Business intelligence implementation
Retail analytics
KPI tracking and performance monitoring
Geographic sales analysis
Time-series analysis
Product and category performance measurement