analyzing student performance
تفاصيل العمل
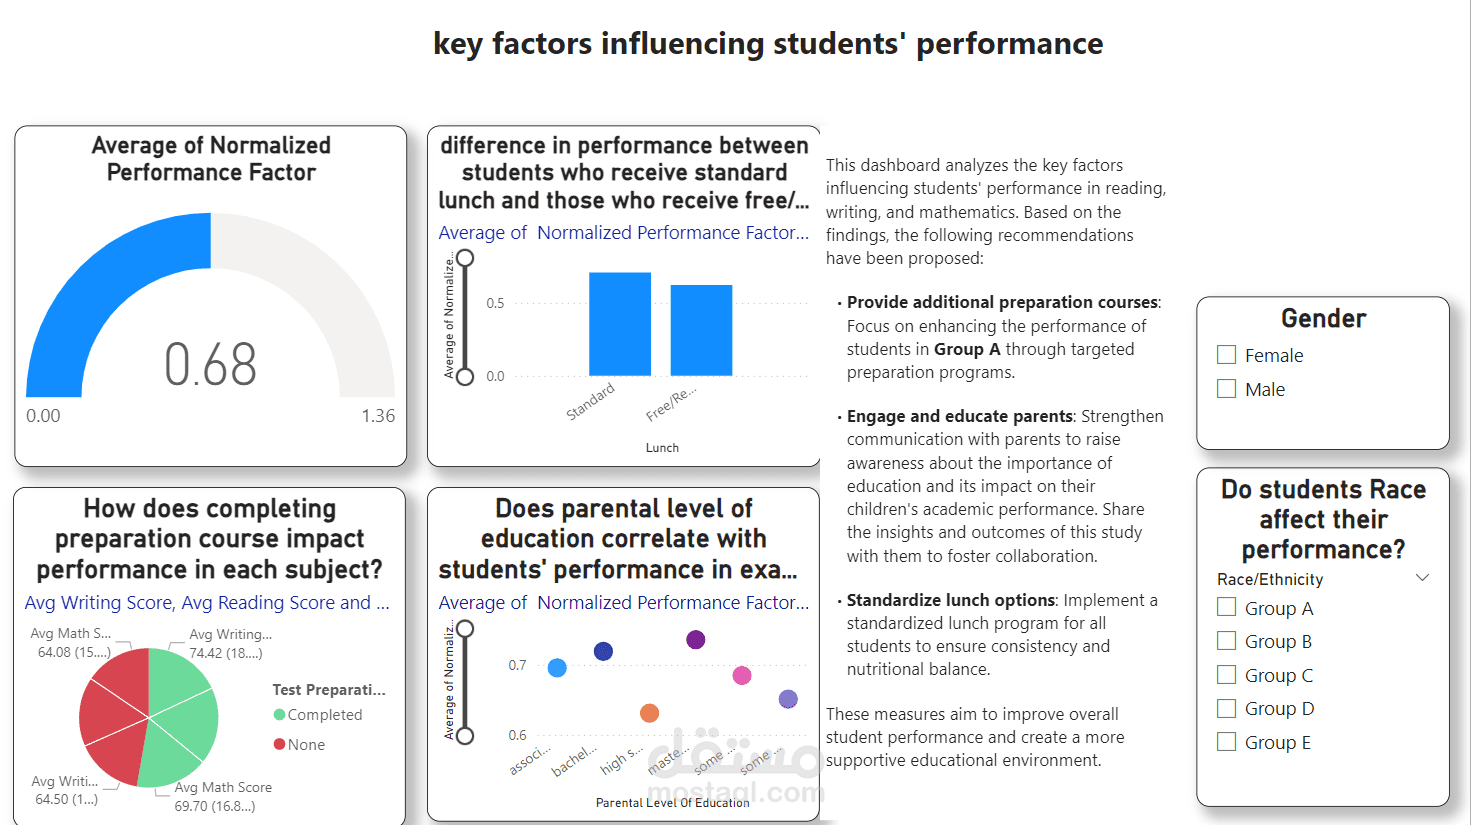
Overall Goal: To identify factors affecting student performance and propose recommendations for improvement.
Key Findings and Visualizations:
Average of Normalized Performance Factor: This gauge chart shows an overall average performance factor of 0.68. The scale ranges from 0.00 to 1.36, suggesting that 0.68 is somewhere in the middle of the possible range. More context is needed to understand what a "normalized performance factor" represents.
Correlation with Parental Education Level: This scatter plot shows the relationship between parental level of education and the average normalized performance factor. There appears to be a positive correlation: higher levels of parental education tend to be associated with higher student performance.
Impact of Race/Ethnicity: The dashboard allows filtering by race/ethnicity (Groups A through E). The impact of race/ethnicity on performance is not directly visualized in a chart on the provided image, but it is implied that the user can