Retail Sales Performance
تفاصيل العمل
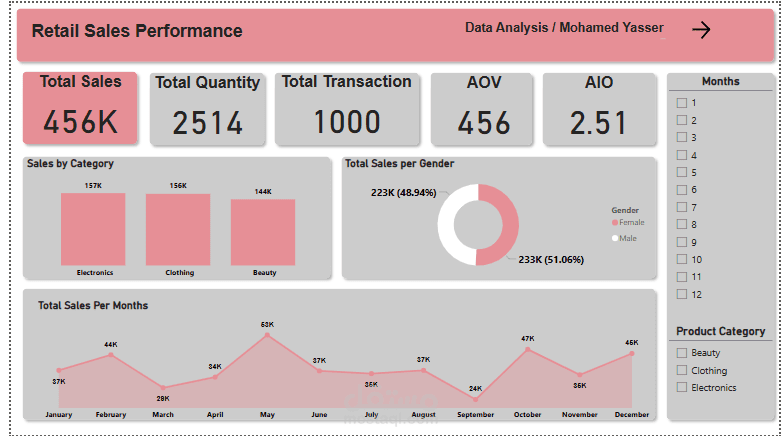

Launching an Advanced Sales Data Analysis Dashboard using Power BI
I am excited to share one of my latest projects in data analysis – a comprehensive Sales Data Analysis Dashboard developed using Power BI.
This dashboard is designed to provide in-depth insights into sales performance, utilizing advanced analytical tools to assist in strategic decision-making. Here are the key analyses implemented:
Total Sales: Calculating the total revenue across all transactions using DAX formulas.
Sales by Category: Analyzing sales by product categories to identify the most profitable ones.
Sales by Gender: Analyzing sales performance by gender to identify key differences.
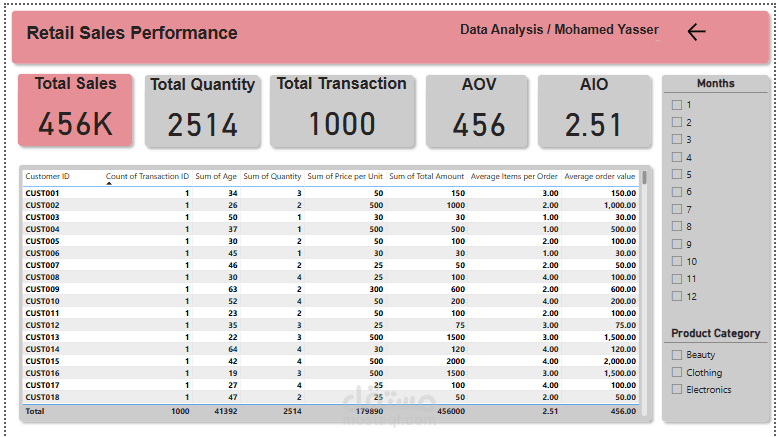
Sales by Age Group: Segmenting customers by age groups and analyzing sales based on these segments.
Number of Transactions: Calculating the total number of transactions to measure customer engagement.
Average Order Value: Calculating the average order value using DAX formulas to assess customer spending.
Sales per Unit: Analyzing sales at the unit level to evaluate the performance of individual products.
Total Quantity Sold: Calculating the total quantity of products sold.
? Data Cleaning: A thorough data cleaning process was performed before analysis to ensure the accuracy and quality of the results.
This dashboard was developed using Power BI, leveraging DAX formulas to perform advanced analysis and deliver accurate, reliable insights that support data-driven decision-making.
This dashboard serves as a powerful and flexible tool for data analysis, enabling businesses to optimize sales strategies and enhance overall performance.
If you're interested in discussing how data analysis can improve business strategies or would like to learn more about the tools I used in this project, feel free to reach out!
#DataAnalysis #SalesAnalytics #PowerBI #BusinessIntelligence #DAX #DataCleaning #DataScience #Dashboard #DataDriven #Analytics #BusinessGrowth