Supplier Quality Analysis
تفاصيل العمل
Executive Summary
This report analyzes supplier performance, defect trends, and plant-specific issues, aiming to identify key areas of improvement to optimize manufacturing processes. Several critical findings emerged, highlighting problematic vendors, materials, and plants. Immediate action is needed to address high defect rates, particularly from vendor Reddoit, and to reduce downtime caused by specific defect types. Further investigation and corrective measures are recommended to ensure better product quality and process efficiency moving forward.
Key Business Questions & KPIs
Supplier Performance
Highest Defect Rates by Supplier: Identifying which suppliers have the highest defect rates and contributing to production inefficiencies.
Downtime Impact from Suppliers: Analyzing which suppliers are responsible for the most production downtime.
Rejected Materials by Supplier: Tracking which suppliers have the highest incidence of material rejections.
Defect Analysis
Top Defect Categories: Identifying the most common defect types and their implications.
Downtime Correlation with Defect Types: Understanding which defects are most responsible for causing production downtime.
Defects by Material Type: Analyzing how defect types vary across different materials.
Defect Trend Over Time: Tracking whether defect frequency is increasing or decreasing.
Plant & Location Performance
Defect Rates by Plant: Identifying plants with the highest defect rates and evaluating their impact on overall production.
Downtime Variation by Plant: Analyzing downtime across plants and identifying the most critical locations needing attention.
Material & Category Insights
Material Defect Rates: Identifying which material types have the highest defect rates.
Downtime Impact by Defect Category: Understanding which defect categories most contribute to downtime.
Data Cleaning and Preprocessing
Defect ID Adjustment: Corrected Defect IDs to align properly, ensuring accurate tracking.
Subcategory Removal: Removed the redundant Subcategory column and renamed Subcategory ID to Category ID for consistency.
Duplicate Removal in Defect Table: Removed duplicate defect entries to improve data integrity, including defects like “Bad Seams” and “Dents.”
Indexed Defect ID: Updated Defect ID to maintain proper indexing after duplicate removal.
Vendor Table Cleaning: Applied the same process of duplicate removal and ID renaming to the Vendor table.
Data Type Correction: Ensured data types are correct in the Defect Report table for accurate modeling and analysis.
Defect ID Mismatch Issue: Identified and addressed the discrepancy where Defect IDs in the Defect Report table exceeded the available Defect IDs, preventing blank values during analysis.
Data Modeling and Structure
Star Schema Design
Established a Star Schema model, ensuring clear relationships between the Defect Report table and other entities like Suppliers, Materials, and Defects.
Eliminated unnecessary Subcategory column, simplifying the schema and improving model efficiency.
One-to-Many Relationships: Connected key columns (e.g., Defect ID, Vendor ID) to the central Defect Report table, ensuring optimized data structure.
DAX Measures
Total Defect Quantity:
Total Defect QTY = SUM('Defect Report'[Defect Qty])
Total Defects Reported:
Total Defects Reported = COUNTROWS('Defect Report')
Total Downtime Minutes:
Total Downtime Mins = SUM('Defect Report'[Downtime min])
Total Rejections:
Total Rejections = CALCULATE(SUM('Defect Report'[Defect ID]), 'Defect'[Defect ID] = 4)
Key Insights
Materials & Vendors
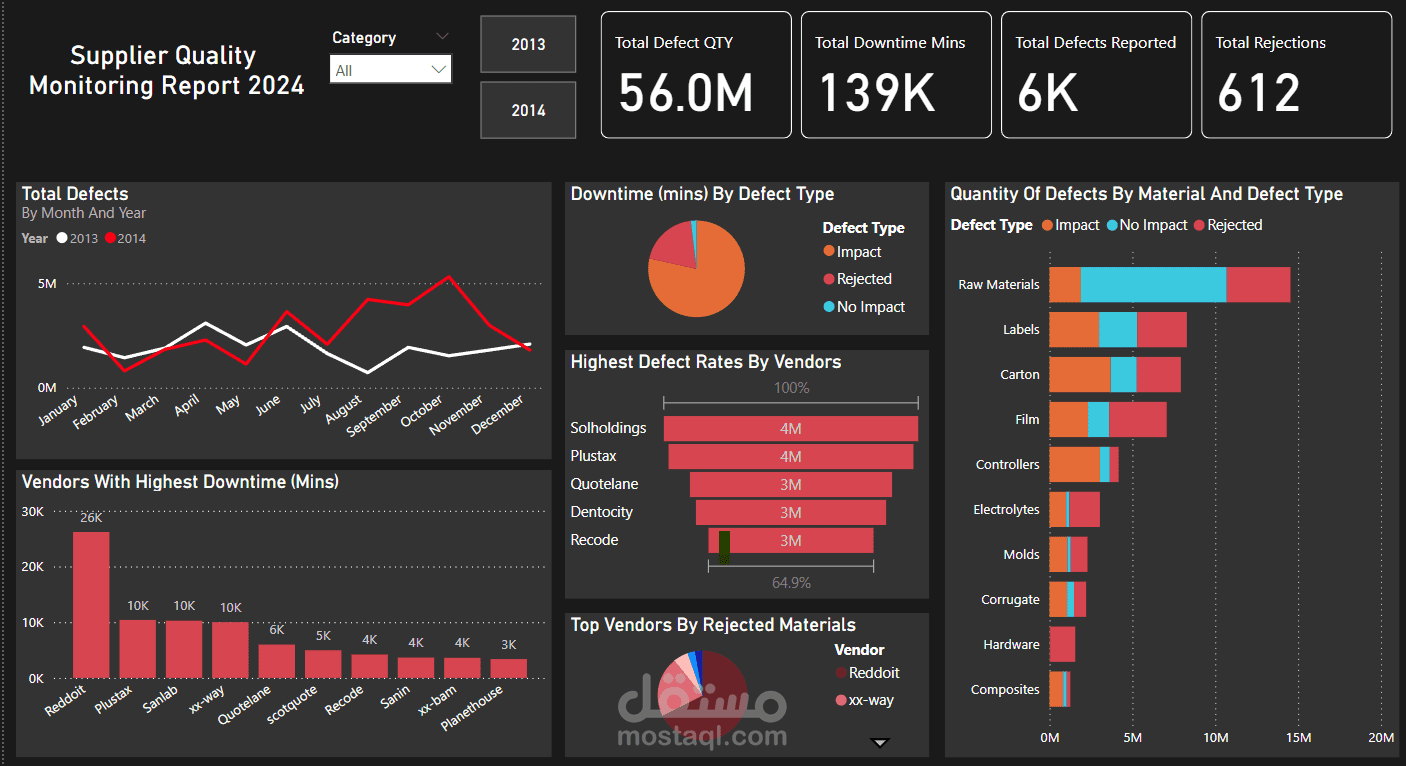
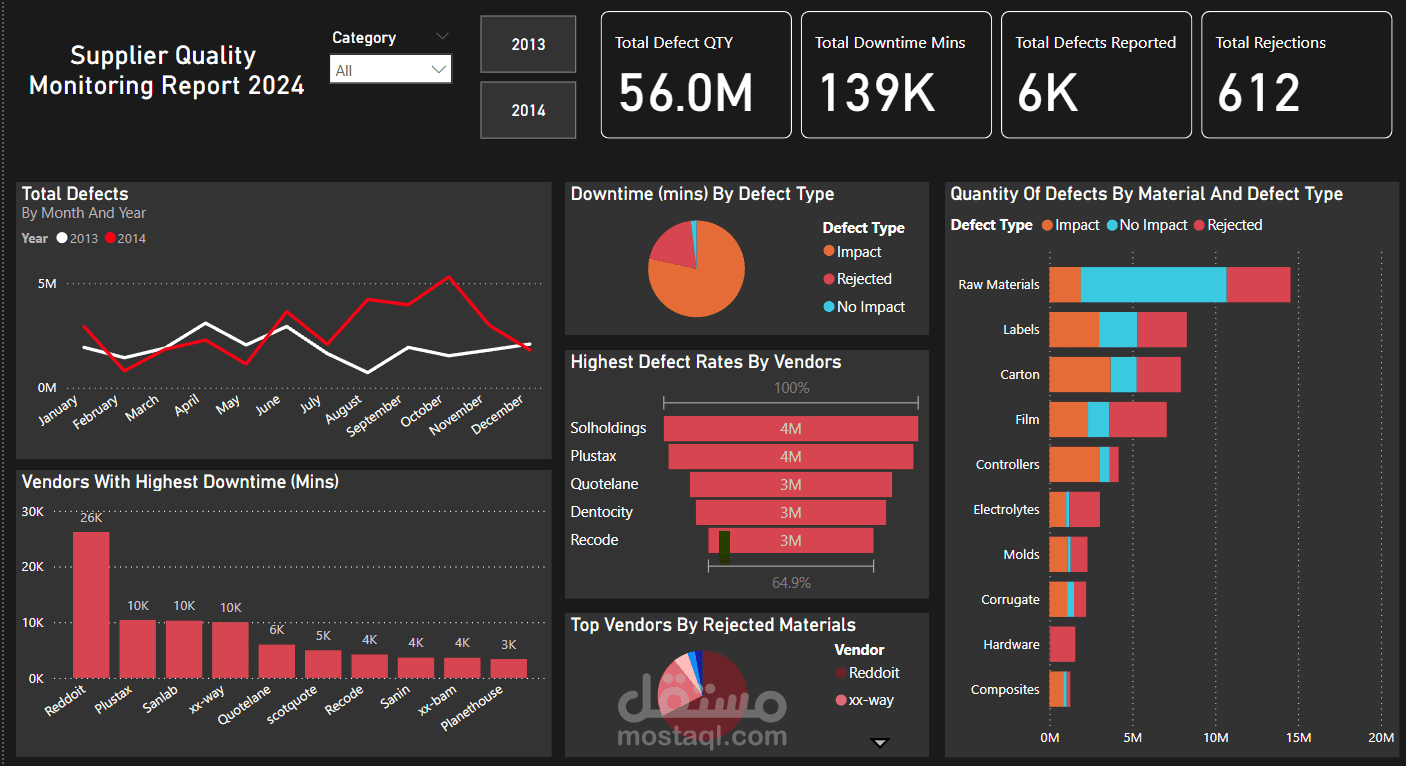
Defect Trends: From May to October 2013, defect rates showed a slight decrease, but 2014 saw a drastic increase in defect rates for the same period.
High Defect Vendors: Vendor Reddoit shows the highest downtime and defect rates, making them a prime candidate for further investigation. Other vendors such as Solholdings and Plustax also exhibit high defect rates, warranting a closer review of their materials and processes.
Material Defects: Raw Materials are responsible for the highest defect rates, suggesting potential issues with material quality from suppliers.
Impact Defects: Most downtime is attributed to defects categorized as “Impact,” highlighting the need to address both material and handling processes.
Plant & Location Performance
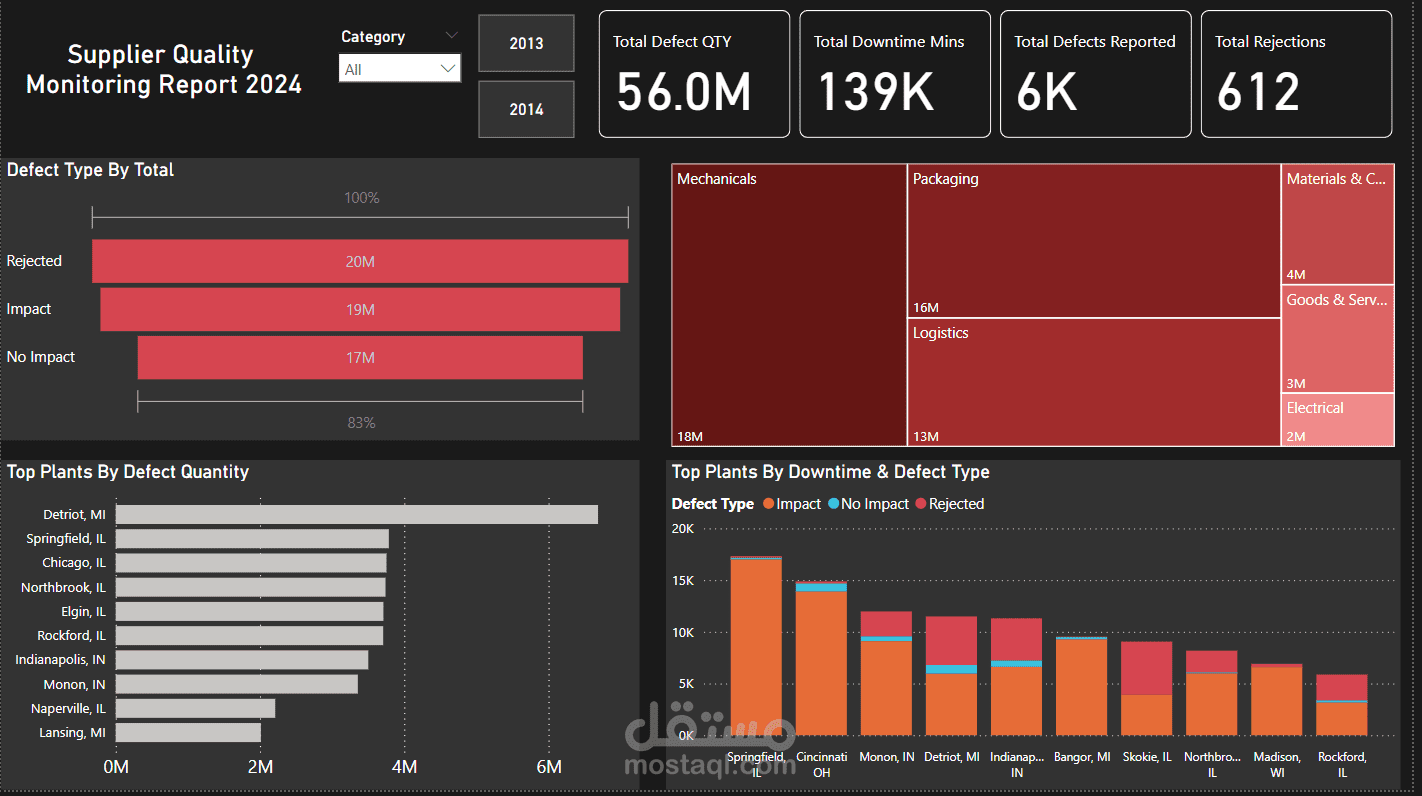
Detroit Plant: The Detroit plant has the highest number of defects, with regions such as Michigan, Illinois, and Indiana contributing most to the defect quantities. A targeted improvement plan should be developed for this location.
Springfield Plant Downtime: The Springfield plant experiences the highest downtime due to Impact-type defects, requiring immediate focus on the handling and storage processes to reduce this downtime.
Mechanical vs. Electrical: Mechanical defects dominate in terms of defect rates, while electrical defects remain minimal. This indicates potential issues with mechanical processes or components, requiring in-depth review.
Actionable Recommendations
Vendor Engagement: Immediate investigations should be conducted for Reddoit, Solholdings, and Plustax. Consider alternative suppliers for critical materials and explore opportunities for process improvements with these vendors.
Raw Material Quality Control: Engage with raw material suppliers to tighten quality control procedures. Implement more rigorous incoming material inspections to reduce defect rates.
Plant-Specific Improvements: For the Detroit plant, a comprehensive quality control audit should be performed to address mechanical defects. For Springfield, focus on reducing downtime from impact-related defects through better handling and storage protocols.
Defect Type Analysis: Focus on addressing Impact-type defects across plants and suppliers. This category is consistently linked to the highest downtime and defects.