Marketing Performance Analysis 2025 for Retaj company
تفاصيل العمل
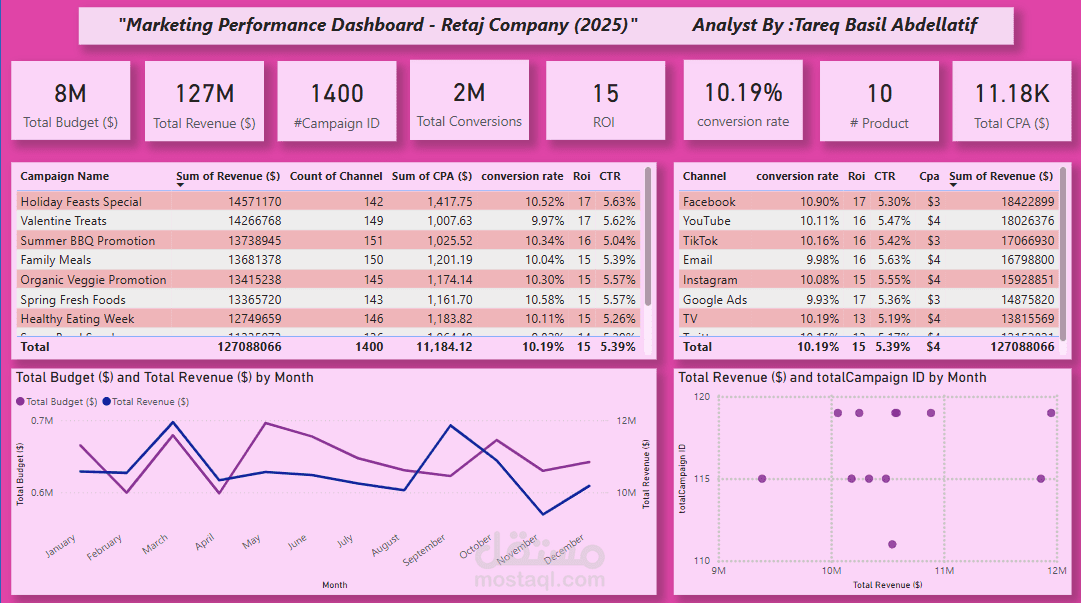
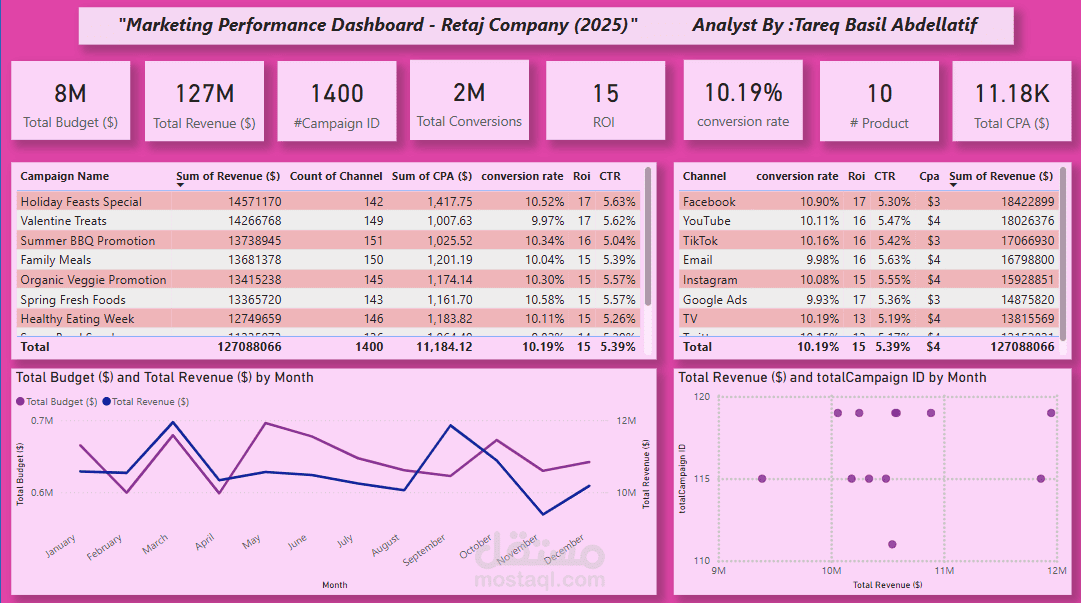
I created this interactive Marketing Performance Dashboard for Retaj Company (2025) using Power BI, showcasing key insights into marketing campaigns, budget allocation, and revenue performance.
Key Findings:
Total Budget: $8M
Total Revenue: $127M
Total Campaigns: 1,400
Total Conversions: 2M
ROI (Return on Investment): 15
Conversion Rate: 10.19%
Top Performing Channels: Facebook, YouTube, and TikTok
Highest Revenue Campaign: "Holiday Feasts Special" generating $14.57M
What’s Included in the Dashboard?
Budget vs. Revenue Trends over the months
Campaign Performance Analysis (CPA, ROI, CTR)
Marketing Channels Effectiveness and their contribution to revenue
Why is this analysis important?
Improves Marketing ROI: Identifies high-performing channels.
Enhances Decision-Making: Helps allocate budgets strategically.
Drives Business Growth: Increases revenue through data-driven insights.
Tools Used: Excel | Power BI | DAX