Superstore Sales Analysis Dashboard
تفاصيل العمل
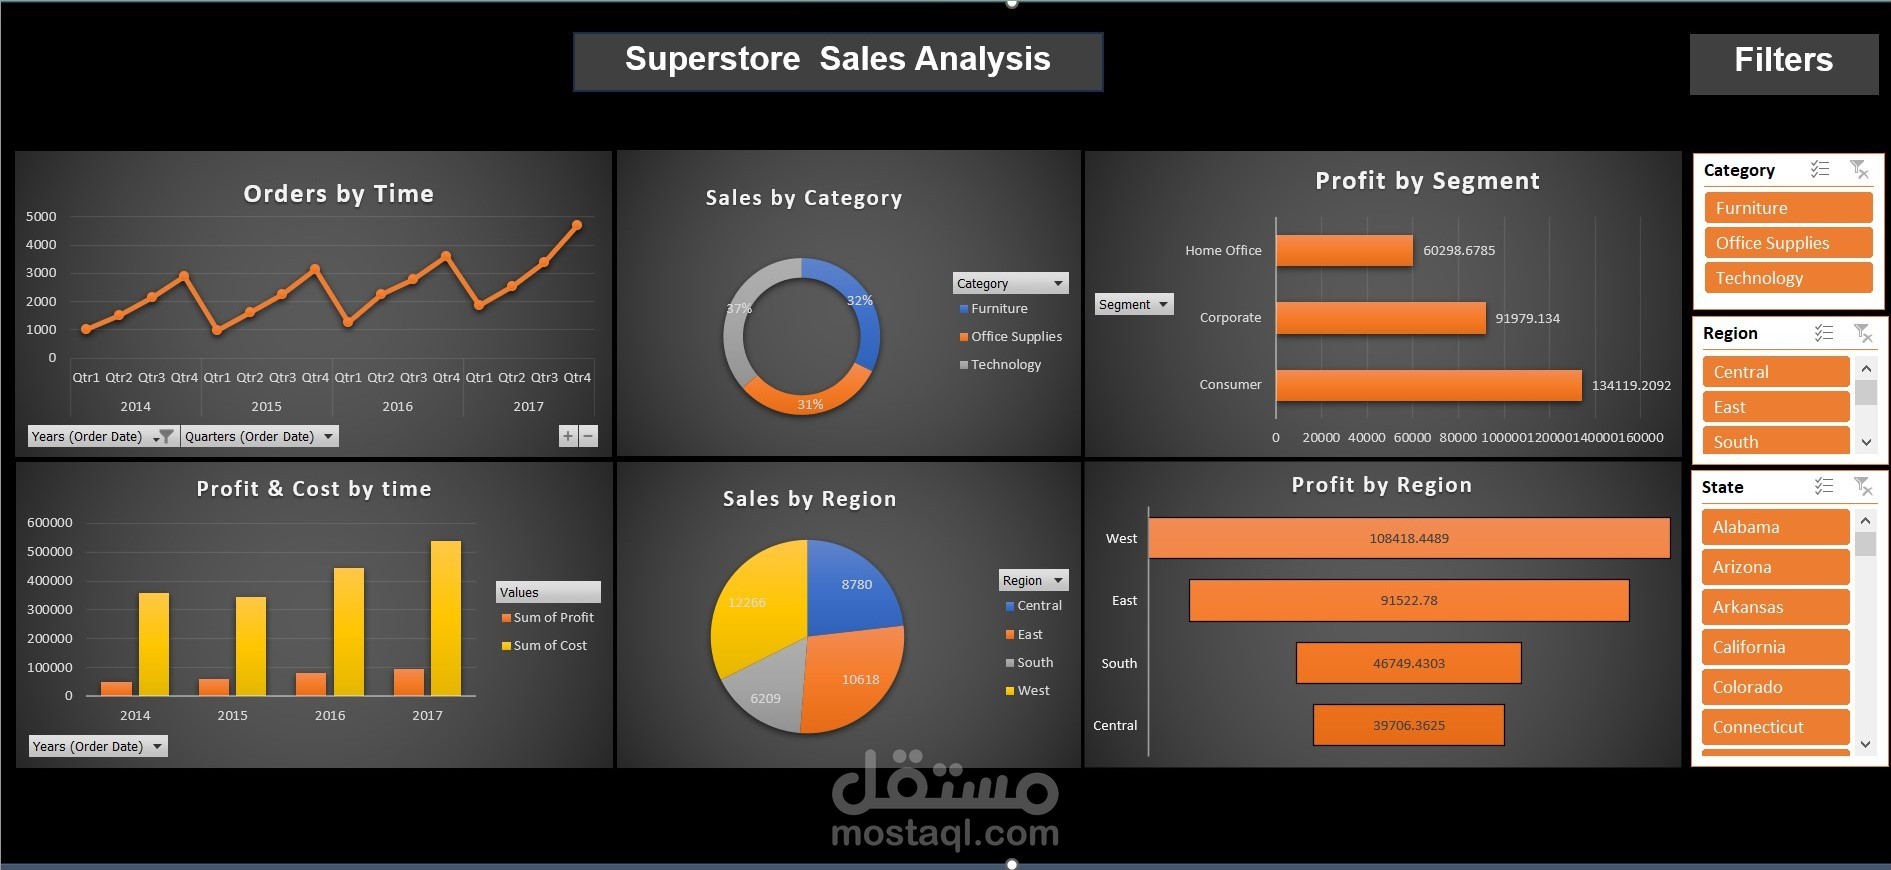
This **Superstore Sales Analysis Dashboard**, created using Excel, provides an interactive and comprehensive overview of sales performance.
Key features include:
- **Orders by Time:** A line chart visualizing order trends over different quarters from 2014 to 2017.
- **Sales by Category:** A donut chart displaying the proportion of sales across Furniture, Office Supplies, and Technology.
- **Profit by Segment:** A bar chart highlighting profit distribution among Home Office, Corporate, and Consumer segments.
- **Profit & Cost Over Time:** A comparative bar chart showing total profit and cost trends from 2014 to 2017.
- **Sales by Region:** A pie chart illustrating sales distribution across different regions.
- **Profit by Region:** A horizontal bar chart comparing profits across Central, East, South, and West regions.
The dashboard includes **interactive filters** for Category, Region, and State, allowing users to customize their analysis dynamically. This visualization aids in identifying sales trends, profitability insights, and business growth opportunities.