Power BI Sales Dashboard – Data Visualization Tasks
تفاصيل العمل
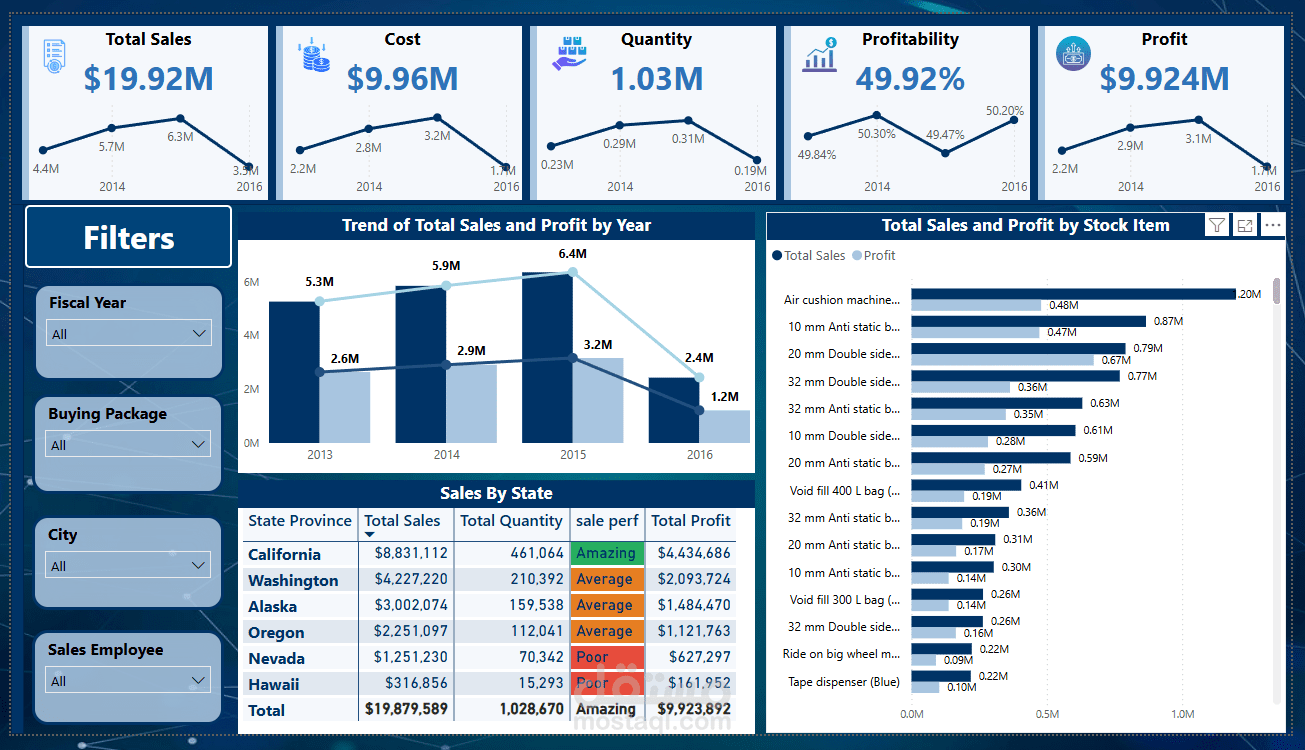
I developed this interactive sales dashboard using Power BI, focusing on data visualization to provide clear insights into sales performance.
Charts & Visualizations Completed:
KPIs Cards – Displaying Total Sales, Cost, Quantity, Profit, and Profitability
Trend Analysis – Line charts showing sales and profit trends over the years
Sales by State – Table with conditional formatting to highlight performance
Top-Selling Items – Bar chart for total sales and quantity by product
Filters & Slicers – Enhancing interactivity for better data exploration