Built an interactive dashboard using Python & MySQL and Power BI
تفاصيل العمل
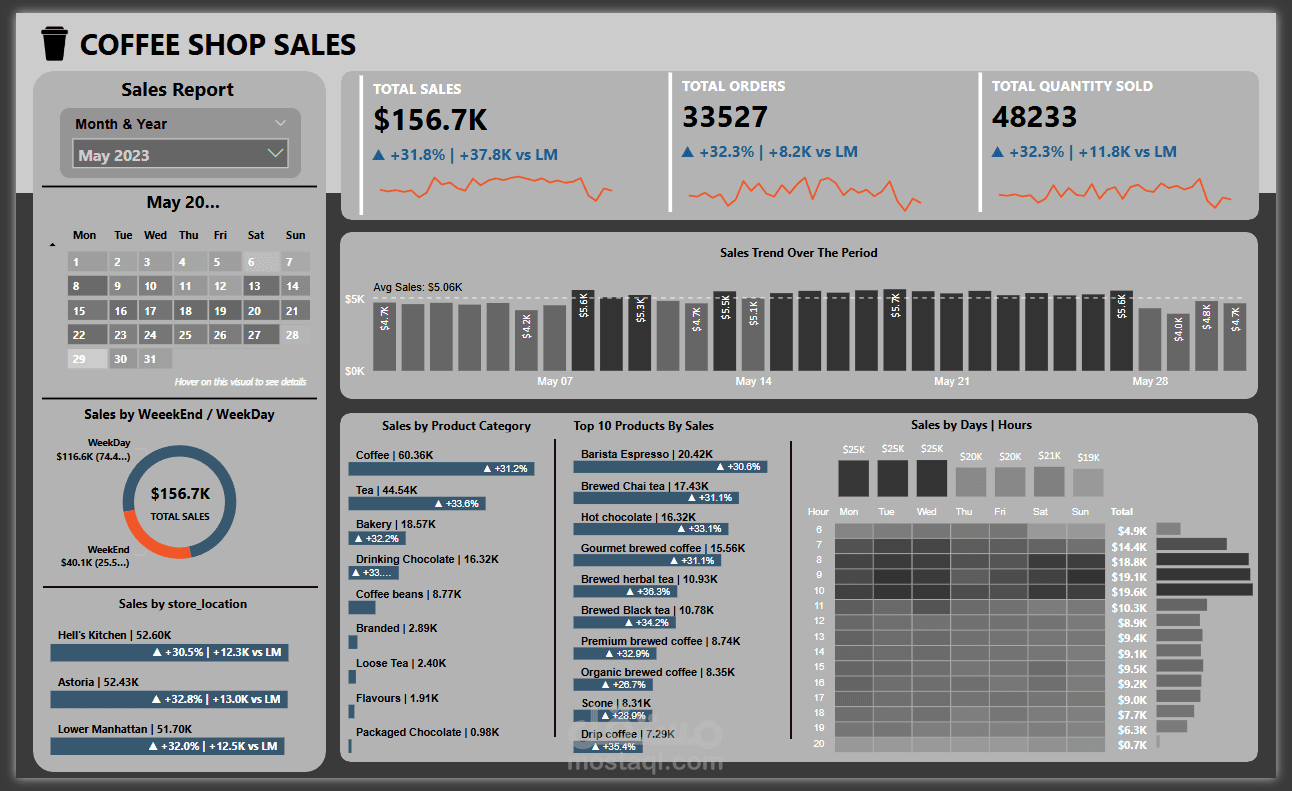
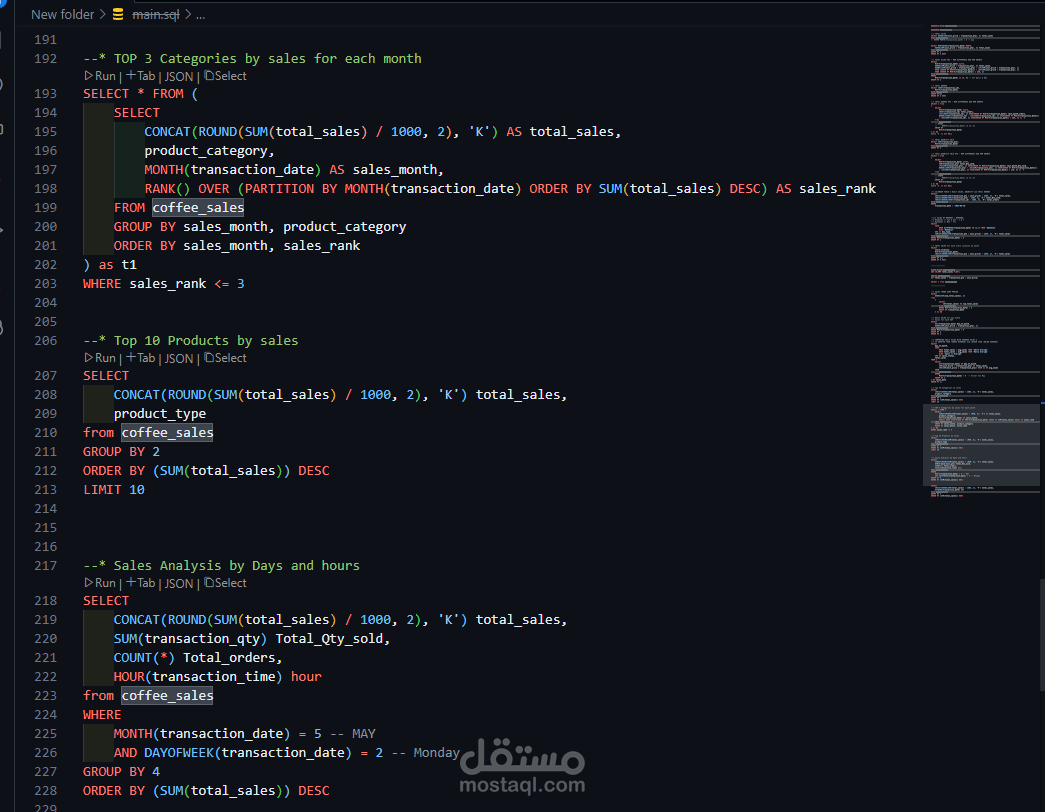
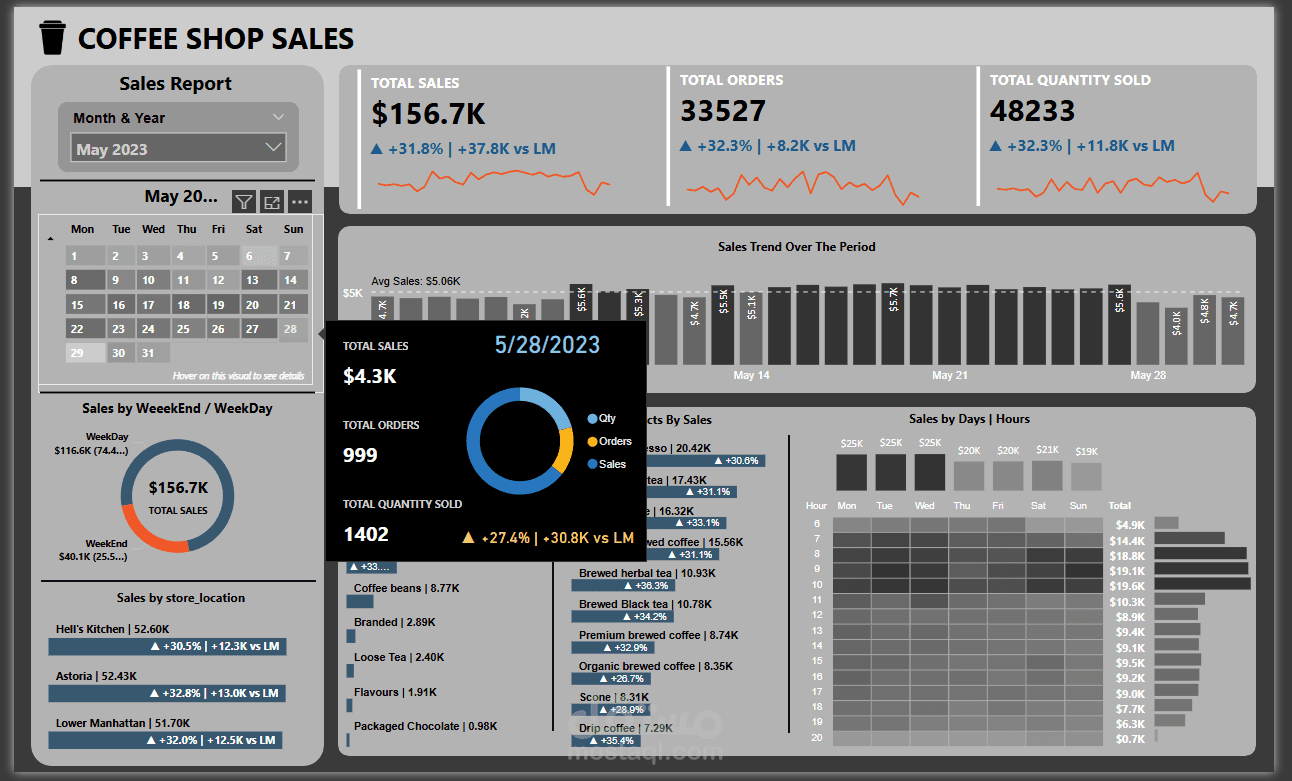
Built an interactive Power BI dashboard analyzing a coffee shop's sales from a MySQL database. I extracted data via SQL, then cleaned and prepped it using Python (Pandas, NumPy, Matplotlib). In Power BI, I created DAX measures for total sales, orders, and quantity sold. The dashboard includes bar charts, line charts, and slicers for daily, weekly, and monthly views. It highlights key metrics (like revenue growth), tracks trends, and identifies top-selling products, helping make data-driven decisions and boost profitability.