Sample Sales Data (5 million transactions)
تفاصيل العمل
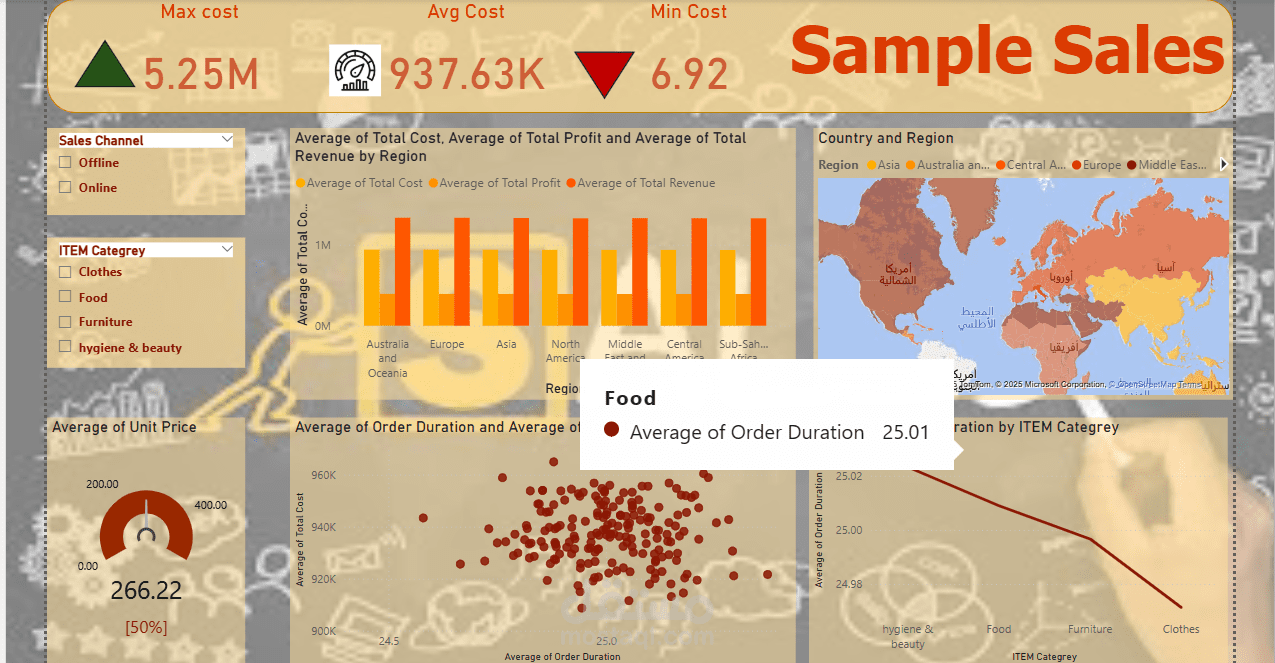
Overview:
This dataset analyzes global sales distribution across countries, focusing on diverse product categories such as food, furniture, and personal care items. It provides granular insights into product pricing, units sold, total costs, net profit, and regional sales performance.
Key Features:
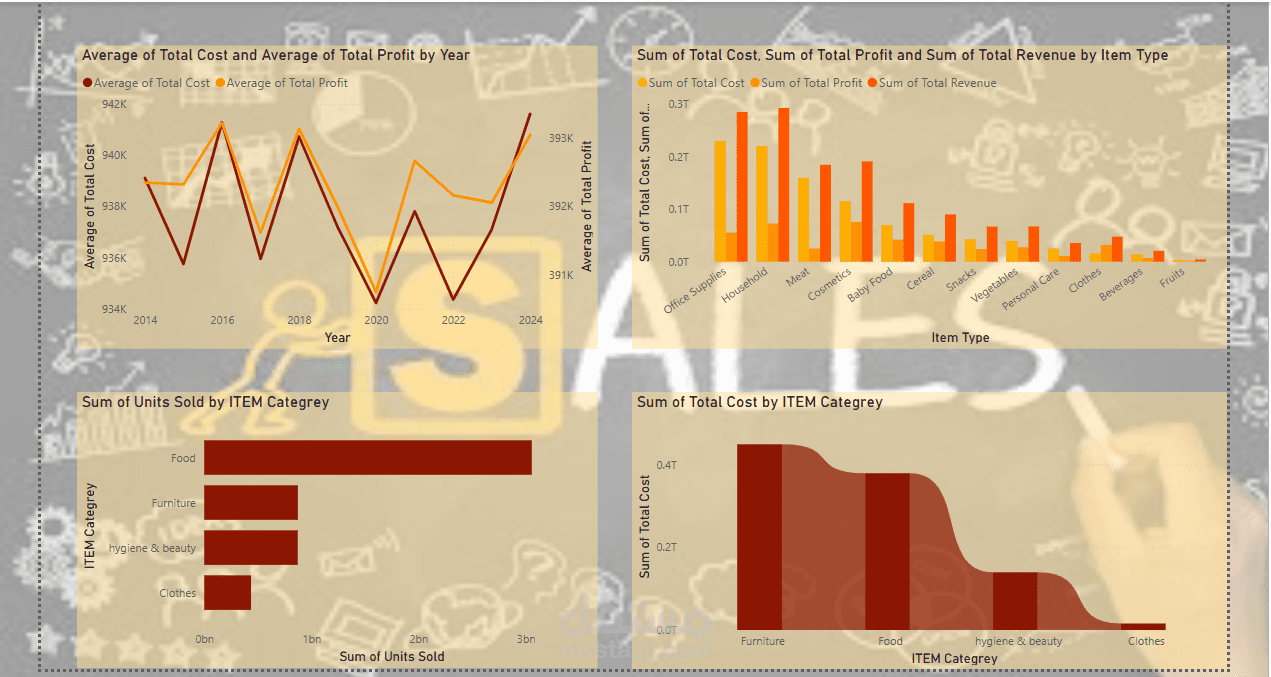
Product Categories: Food (fruits, vegetables, snacks), furniture, personal care, and more.
Sales Metrics: Price per product, units sold, total costs, net profit per transaction.
Geographic Insights: Country-level sales distribution and demand patterns.
Tools & Methodology:
1. Microsoft Excel & Power Query (Data Cleaning & Transformation):
Cleaning: Structured raw data using Power Query to ensure clarity and consistency (e.g., standardized formats, resolved missing values).
Transformations:
Added a delivery duration metric by calculating the days between order and delivery dates.
Grouped similar products into unified categories (e.g., fruits, vegetables → Food).
2. Microsoft Power BI (Visual Analytics):
Designed an interactive dashboard to highlight:
Sales-to-cost ratios across regions.
Top-selling products and their profitability.
Trends in delivery efficiency (e.g., shortest delivery times for perishable goods)