Income Statement Dashboard Analysis
تفاصيل العمل

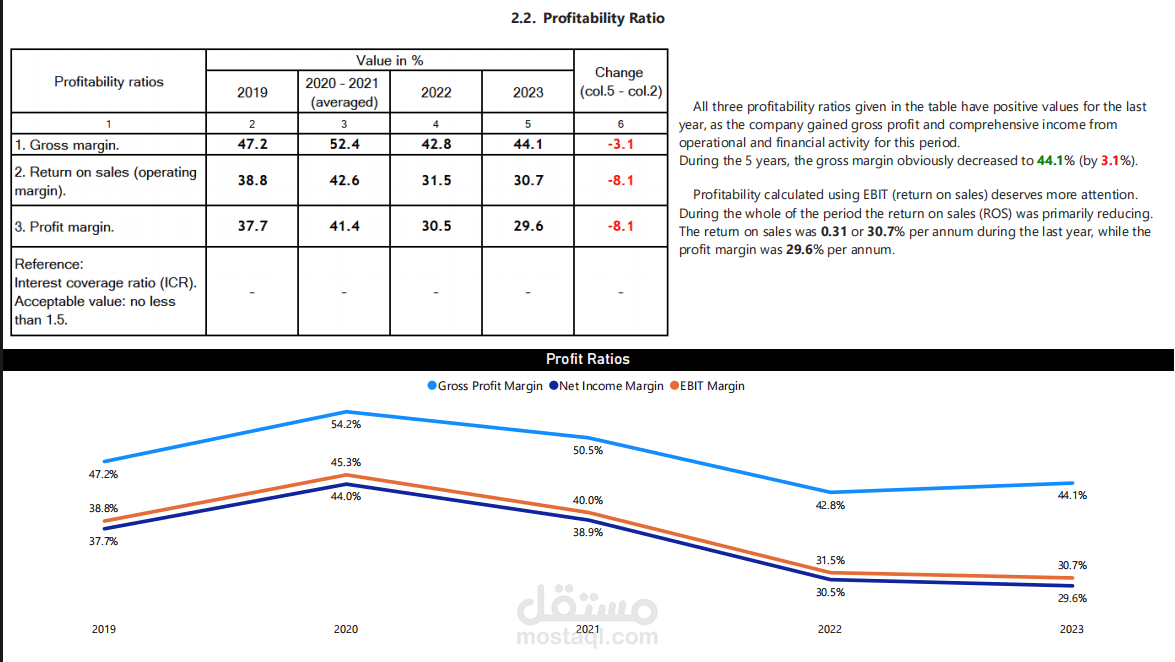
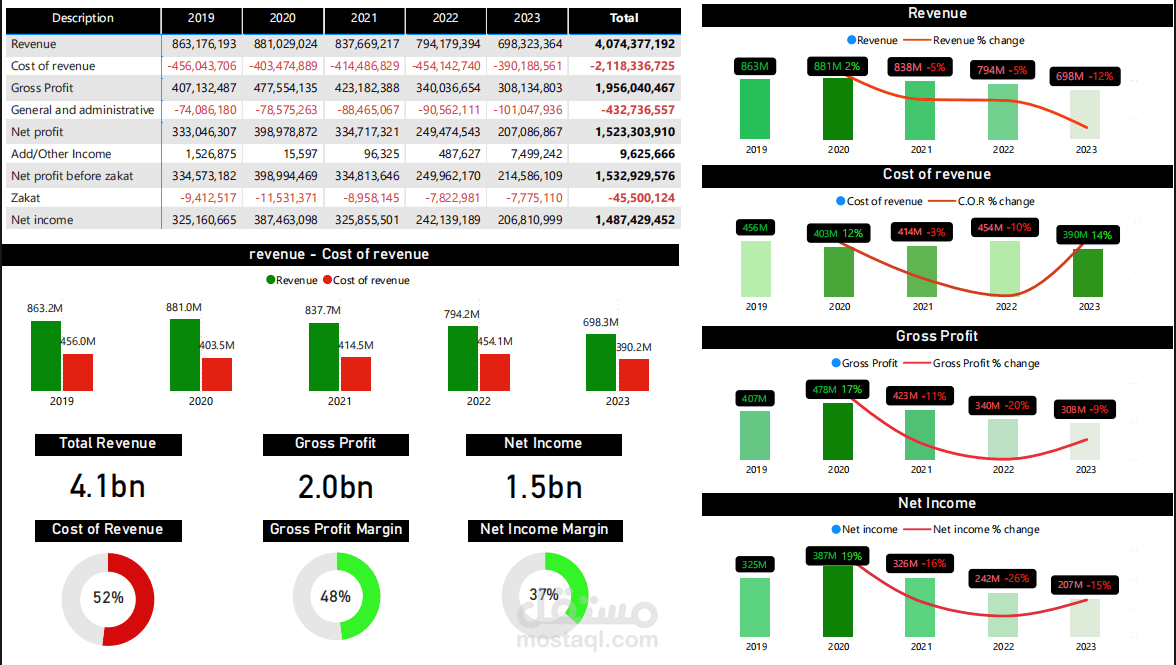
This Power BI project developed an interactive dashboard to analyze financial performance from 2019 to 2023. It visualizes revenue, costs, profits, and key performance indicators like profit margins, enabling trend identification and profitability analysis.
Benefits:
Enhanced financial decision-making.
Identification of opportunities to improve profitability and cost management.
Clear visualization of financial data.