تحليل مالي
تفاصيل العمل
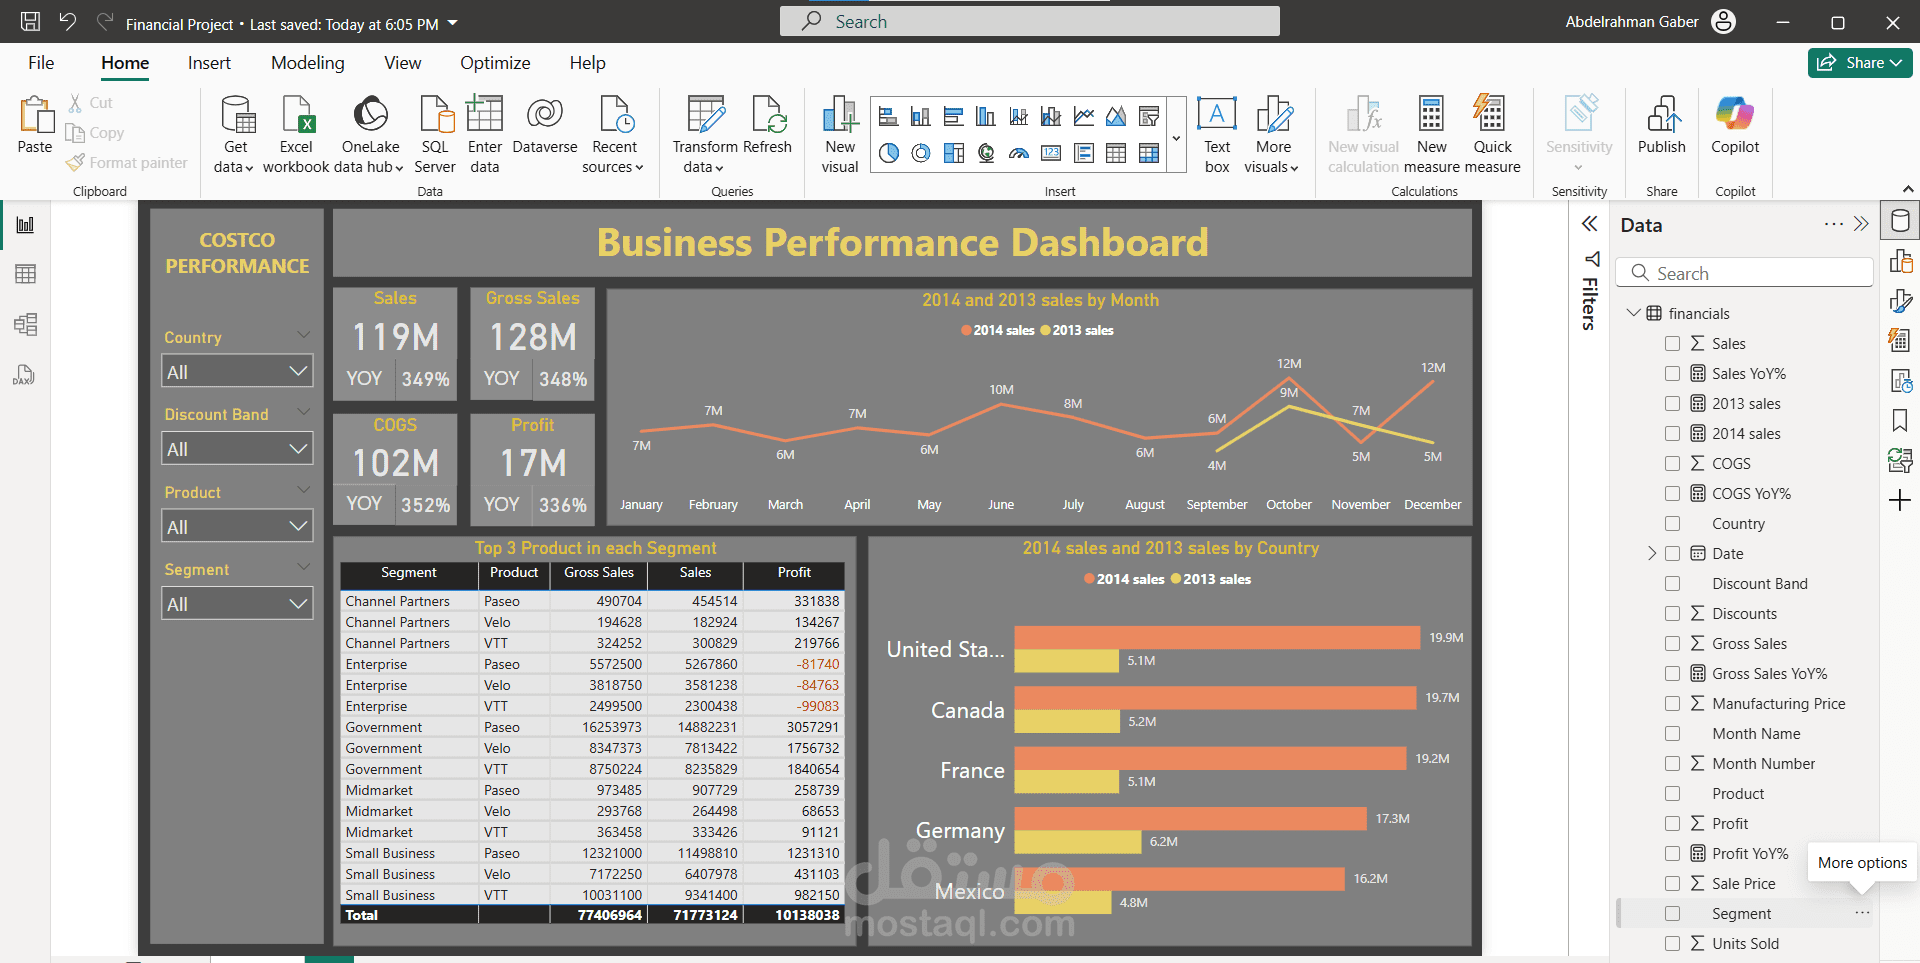
The project involves developing a Business Performance Dashboard in Power BI to analyze sales, gross sales, cost of goods sold (COGS), and profit across different segments, products, and countries. The dashboard provides key financial metrics, year-over-year (YoY) comparisons, and visual insights to help businesses track performance trends. Filters for country, discount band, product, and segment enhance data exploration. The visualization includes line charts, bar charts, and data tables to present sales trends over time and across regions, enabling data-driven decision-making.