Logistics & Fleet Tracking Dashboard
تفاصيل العمل
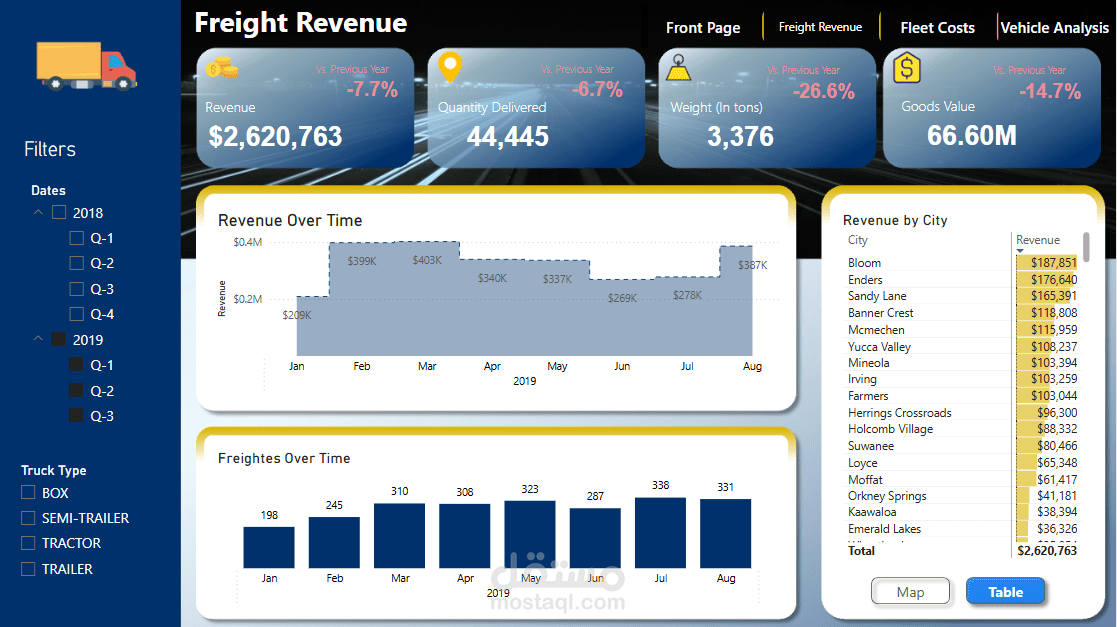
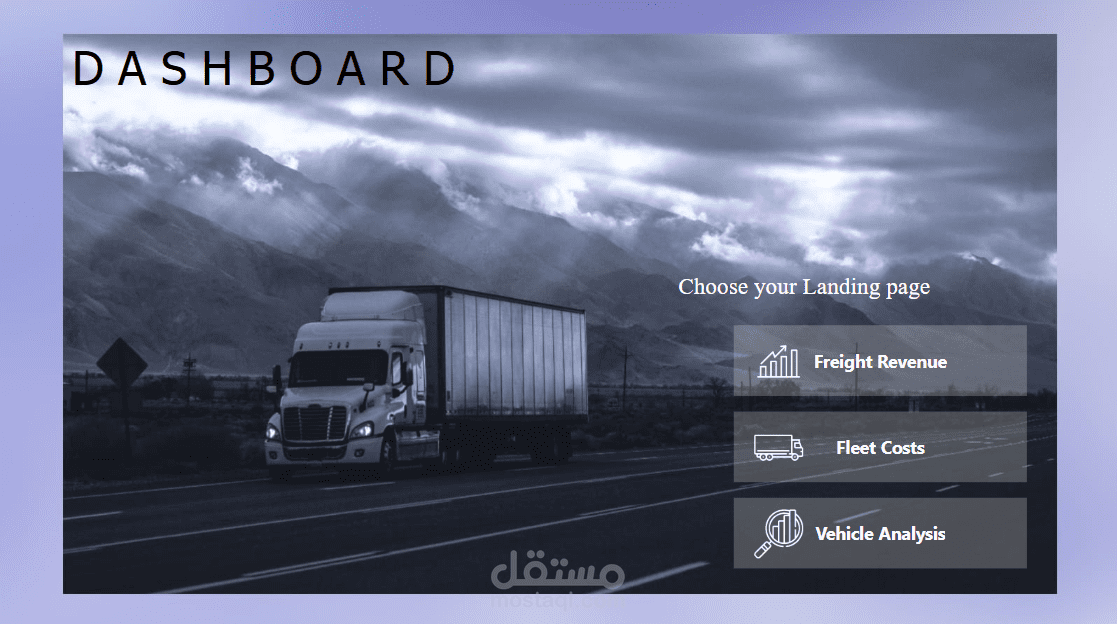
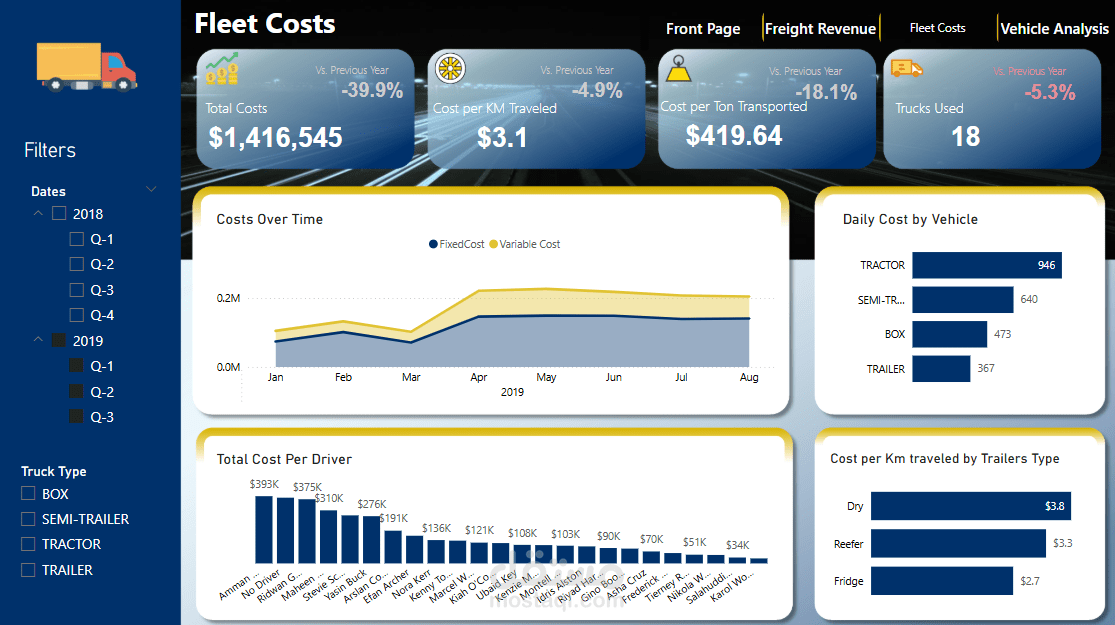
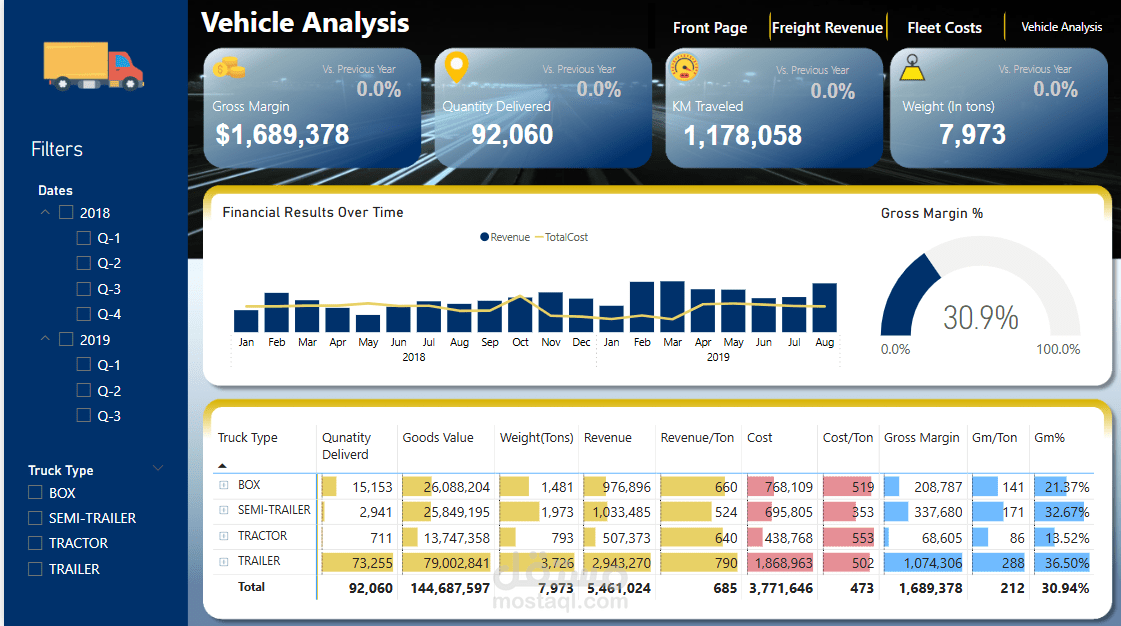
In this project, we analyzed logistics and transportation data using Power BI, focusing on costs, revenue, and driver performance. We worked with multiple tables, including drivers, vehicles, customers, costs, and freight, establishing relationships between them. We used DAX measures to calculate key metrics such as total cost, gross margin, cost per km, and year-over-year (YoY) revenue and costs. We implemented conditional formatting with DAX logic to highlight trends and anomalies, ensuring clear data visualization. Additionally, we built a dynamic dashboard with bar charts, KPIs, and filters to track performance over time. Finally, we published the dashboard online using GitHub Pages, making it interactive and accessible for real-time insights.