Sales Data Analysis
تفاصيل العمل
Project Description
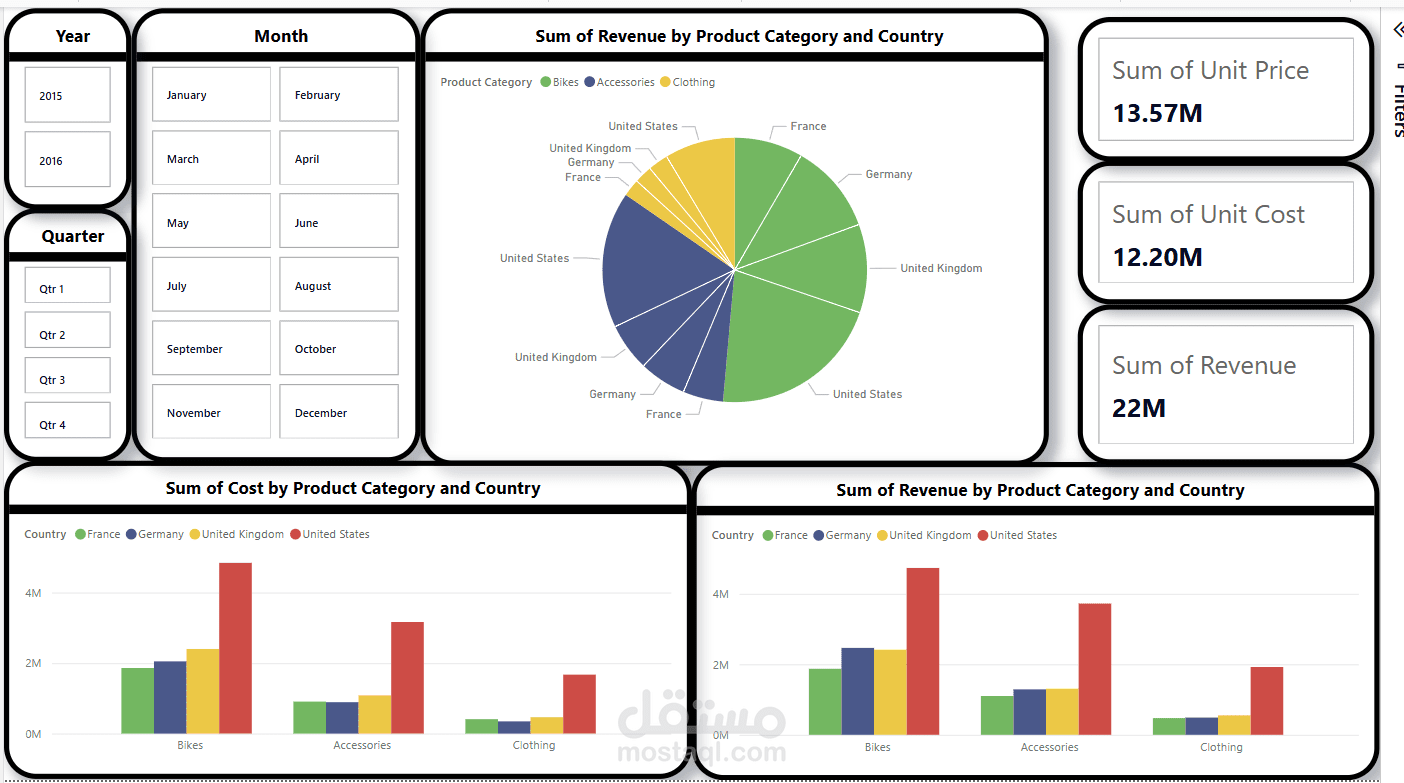
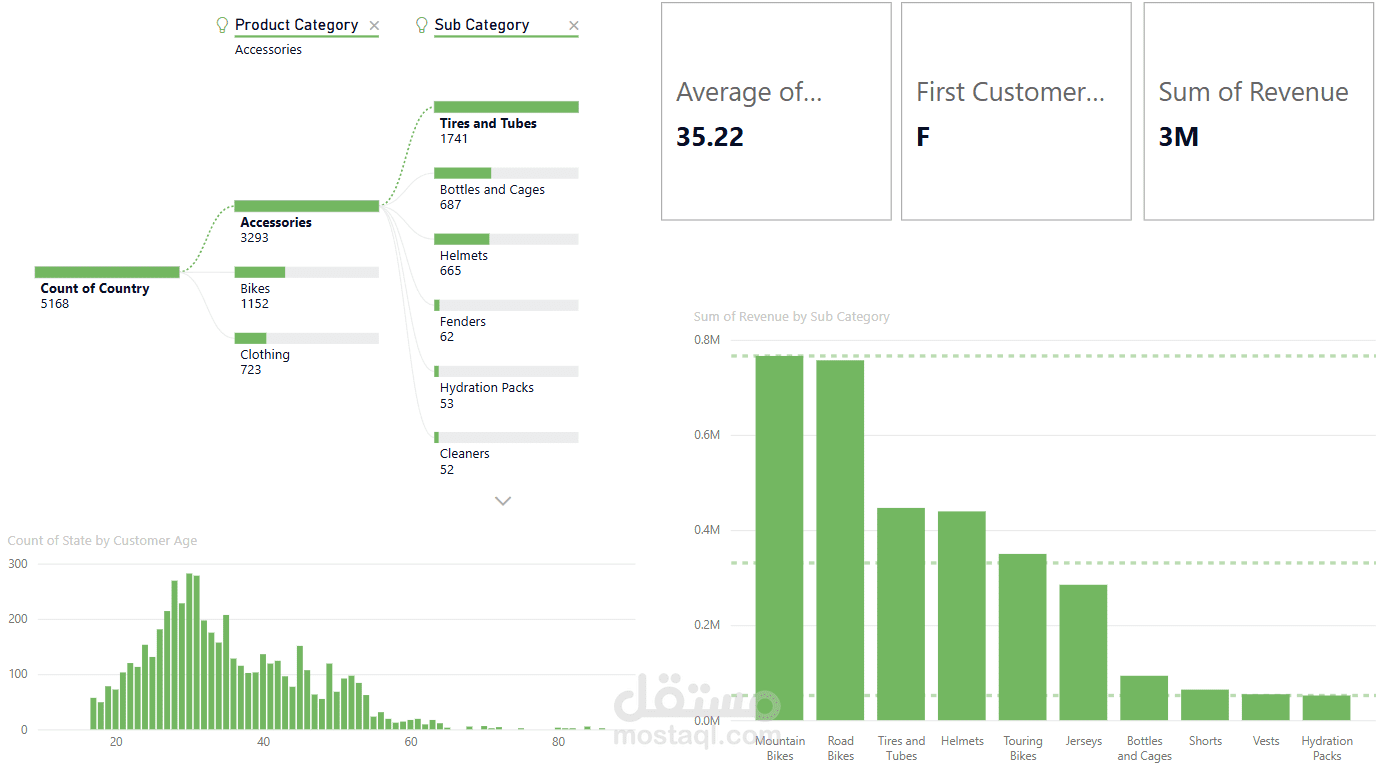
This project is an analytical dashboard that visualizes revenue and cost data across different countries and product categories. It provides a clear overview of product performance in various markets, enabling data-driven decision-making.
Project Objectives:
Analyze revenue and costs by category and country.
Compare performance across different markets (United States, United Kingdom, Germany, and France).
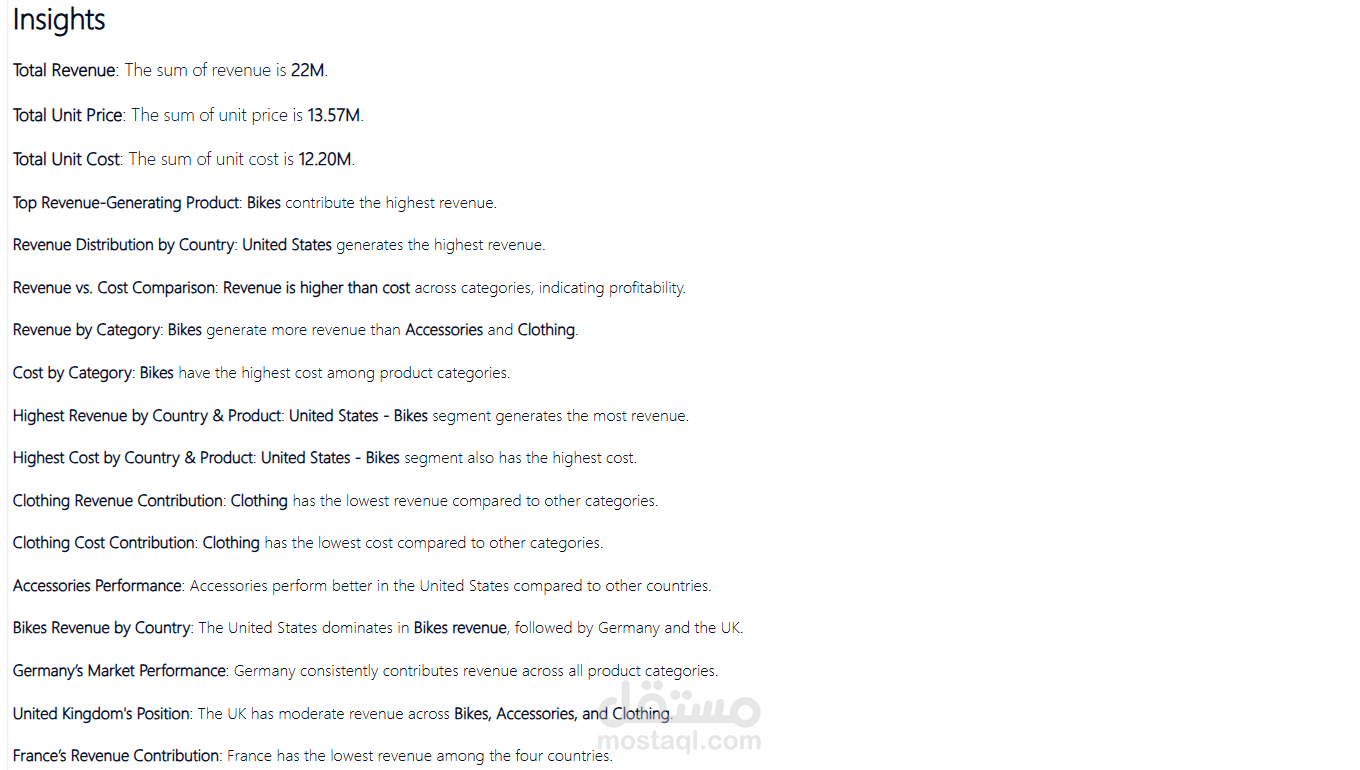
Identify the most profitable product categories to guide marketing and operational decisions.
Enable filtering by year, quarter, and month for detailed time-based analysis.
Deliverables:
Charts and graphs highlighting revenue and cost differences.
Key metrics such as total revenue, total unit cost, and total unit price.
Performance insights by category (Bikes, Accessories, Clothing) to identify top-performing and underperforming segments.
Further analysis can include forecasting trends or comparisons with previous periods for deeper business insights.