Sales Power Bi dashboard
تفاصيل العمل
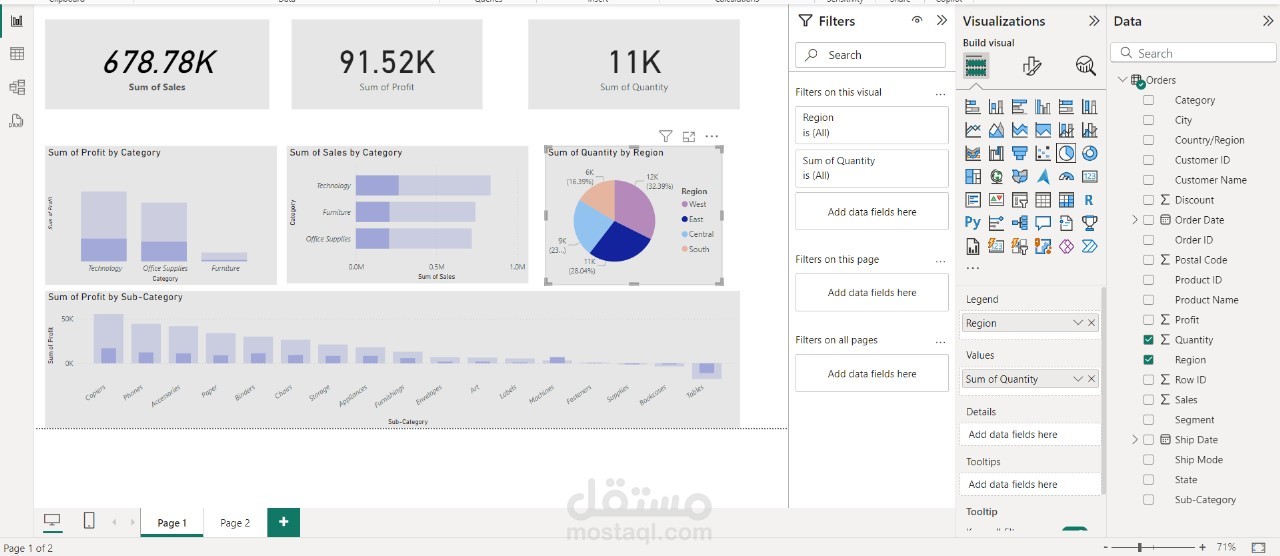
This Sales Performance Dashboard provides a comprehensive overview of key business metrics, helping to analyze sales, profit, and quantity distribution across different categories, sub-categories, and regions. It supports data-driven decision-making for business growth and optimization.
Key Insights:
Overall Metrics:
Total Sales: $678.78K
Total Profit: $91.52K
Total Quantity Sold: 11K
Profit & Sales Analysis:
Sum of Profit by Category: Compares profitability across Technology, Office Supplies, and Furniture.
Sum of Sales by Category: Highlights the revenue distribution across different product categories.
Sum of Profit by Sub-Category: Displays detailed profit margins for various sub-categories such as Phones, Accessories, Paper, Binders, Chairs, and more.
Regional Analysis:
Sum of Quantity by Region: A pie chart showing the distribution of sold products across West, East, Central, and South regions, helping to identify high-demand areas.
This dashboard enables sales teams and management to track performance, identify profitable categories, and strategize sales efforts based on regional demand.