Employee Data Analysis Using Excel: Insights & Trends
تفاصيل العمل
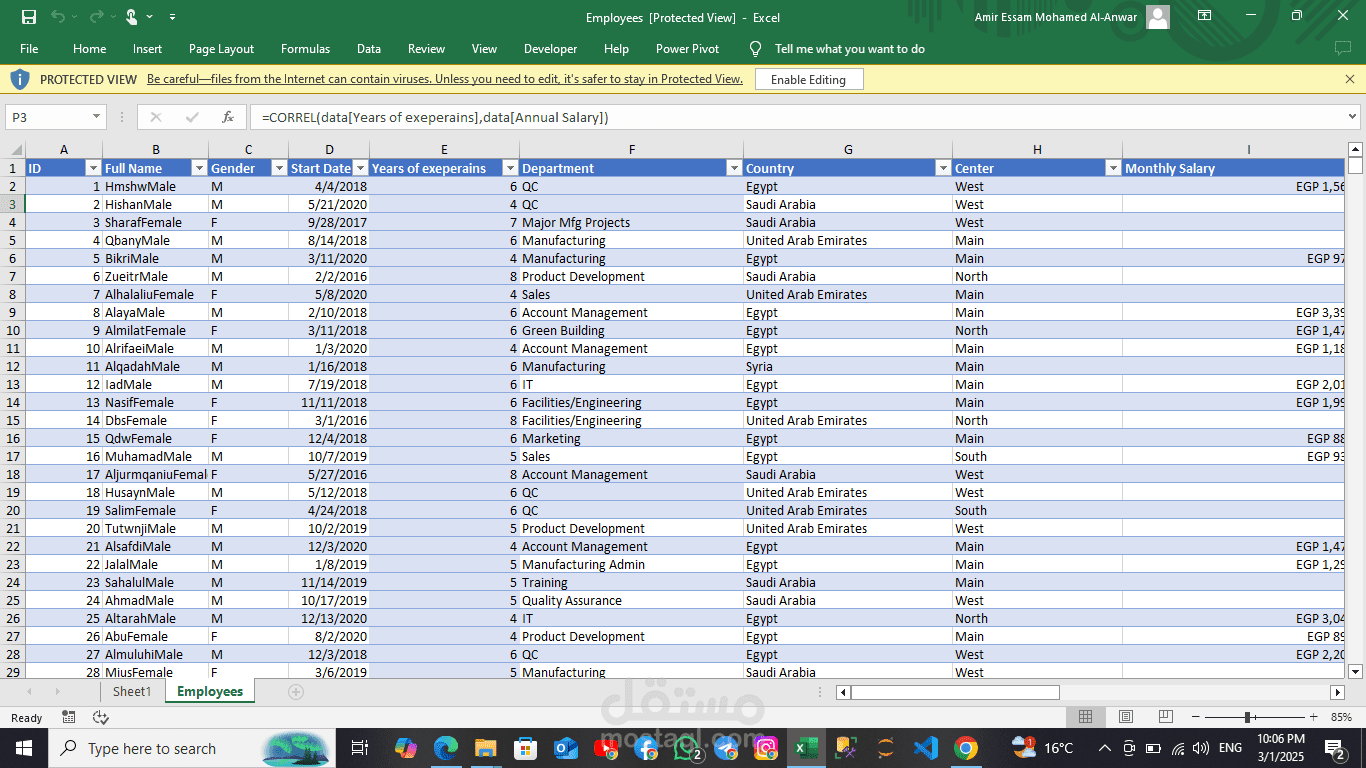
This project focuses on analyzing employee data using Excel to extract key insights and trends. It includes data cleaning, organizing, and applying various Excel functions such as PivotTables, VLOOKUP, and conditional formatting. Visualizations like charts and graphs were created to present salary distributions, department-wise performance, and employee demographics. The project demonstrates proficiency in data analysis, reporting, and decision-making support using Excel tools.