Blinkit Sales - Power BI Analysis
تفاصيل العمل
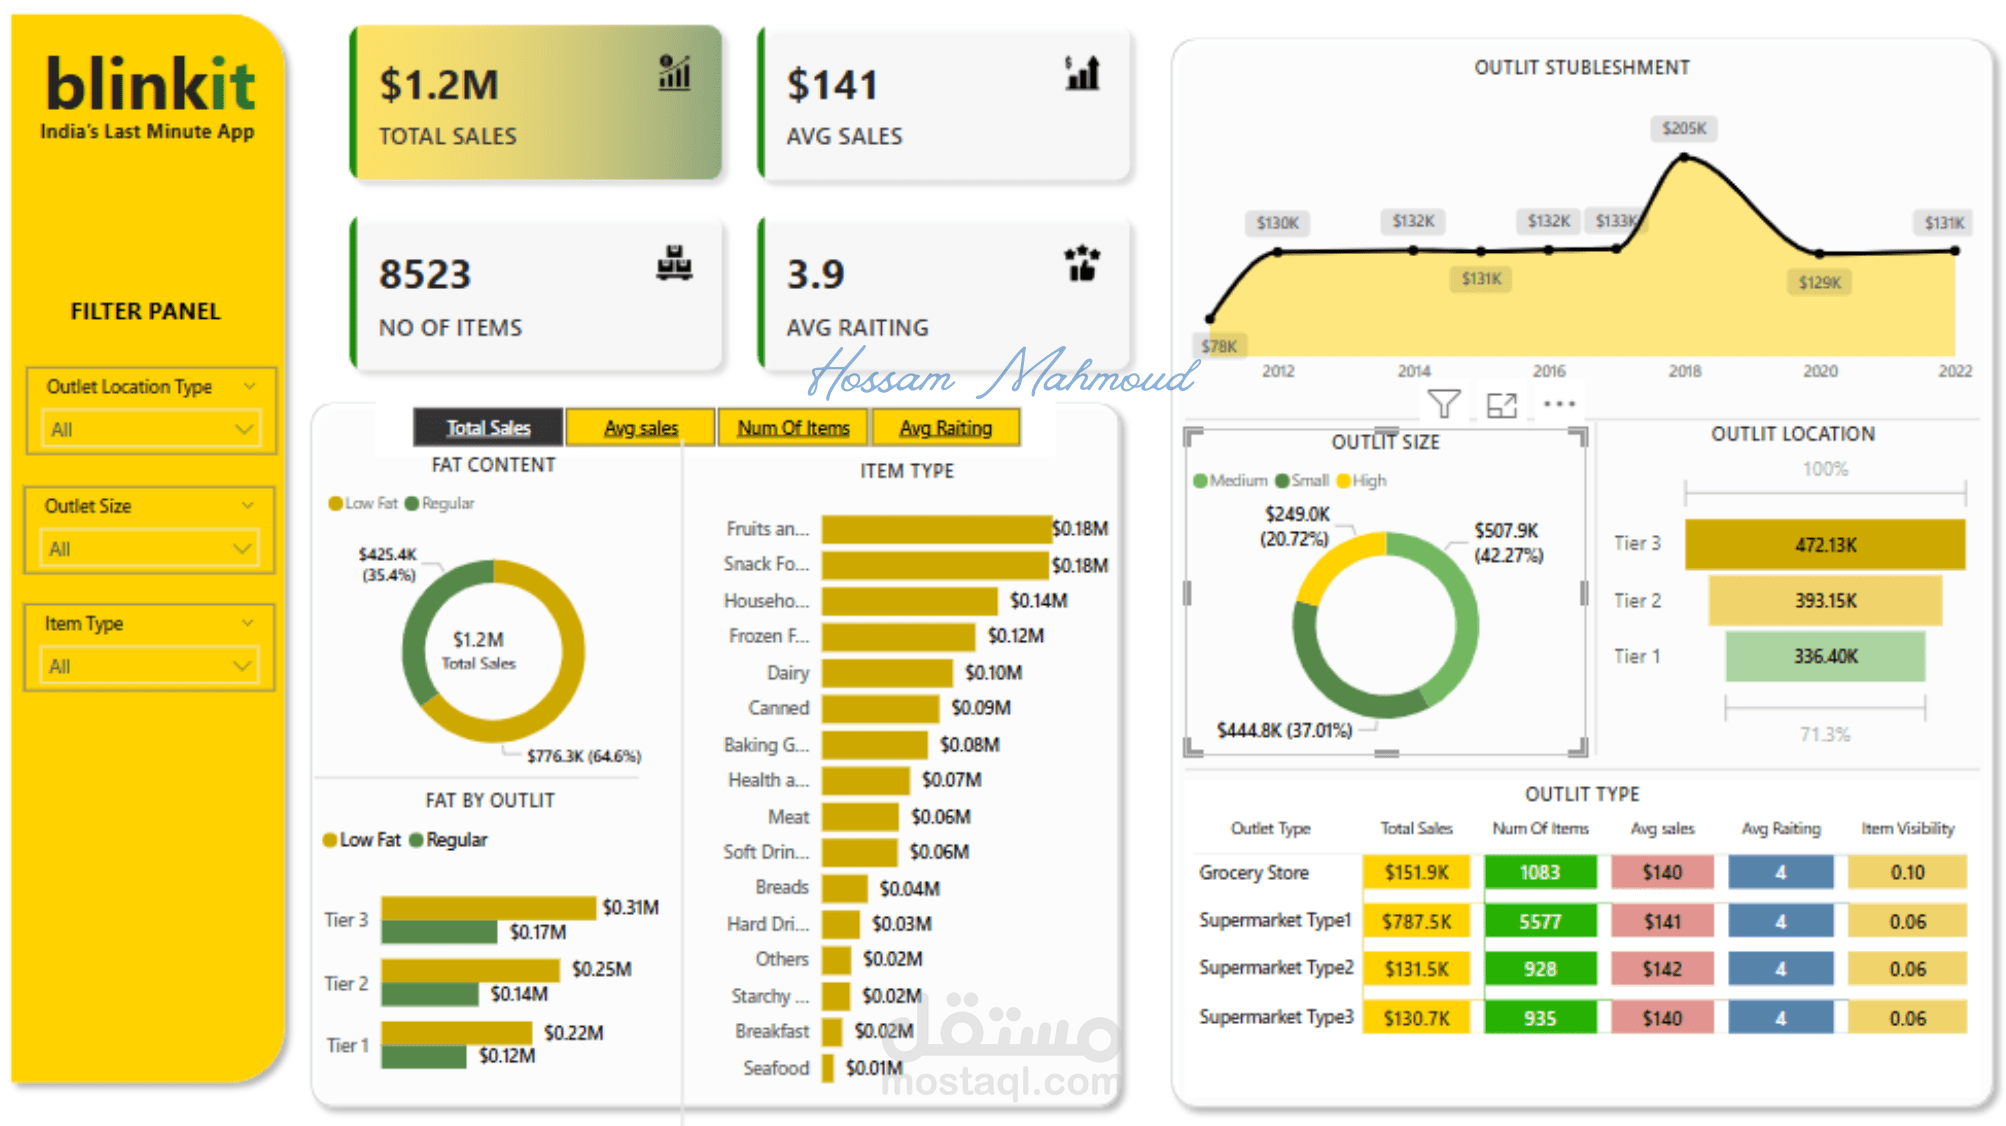
This Power BI dashboard provides a comprehensive analysis of Blinkit’s sales data, helping stakeholders make data-driven decisions. The dashboard visualizes key metrics such as total sales, average sales, item performance, outlet types, and customer ratings. Users can filter data by outlet location, size, and item type to gain deeper insights into sales trends.
Deliverables:
Interactive Power BI Dashboard – Displays sales trends, outlet performance, and item categories
Outlet Performance Report – Breakdown of outlet locations, size, and sales contribution
Sales Analysis – Visuals highlighting top-performing items and categories
Filter Panel & Drill-Down Insights – Allows users to customize views and explore specific data points