Sales Performance Dashboard And Sales Analysis
تفاصيل العمل
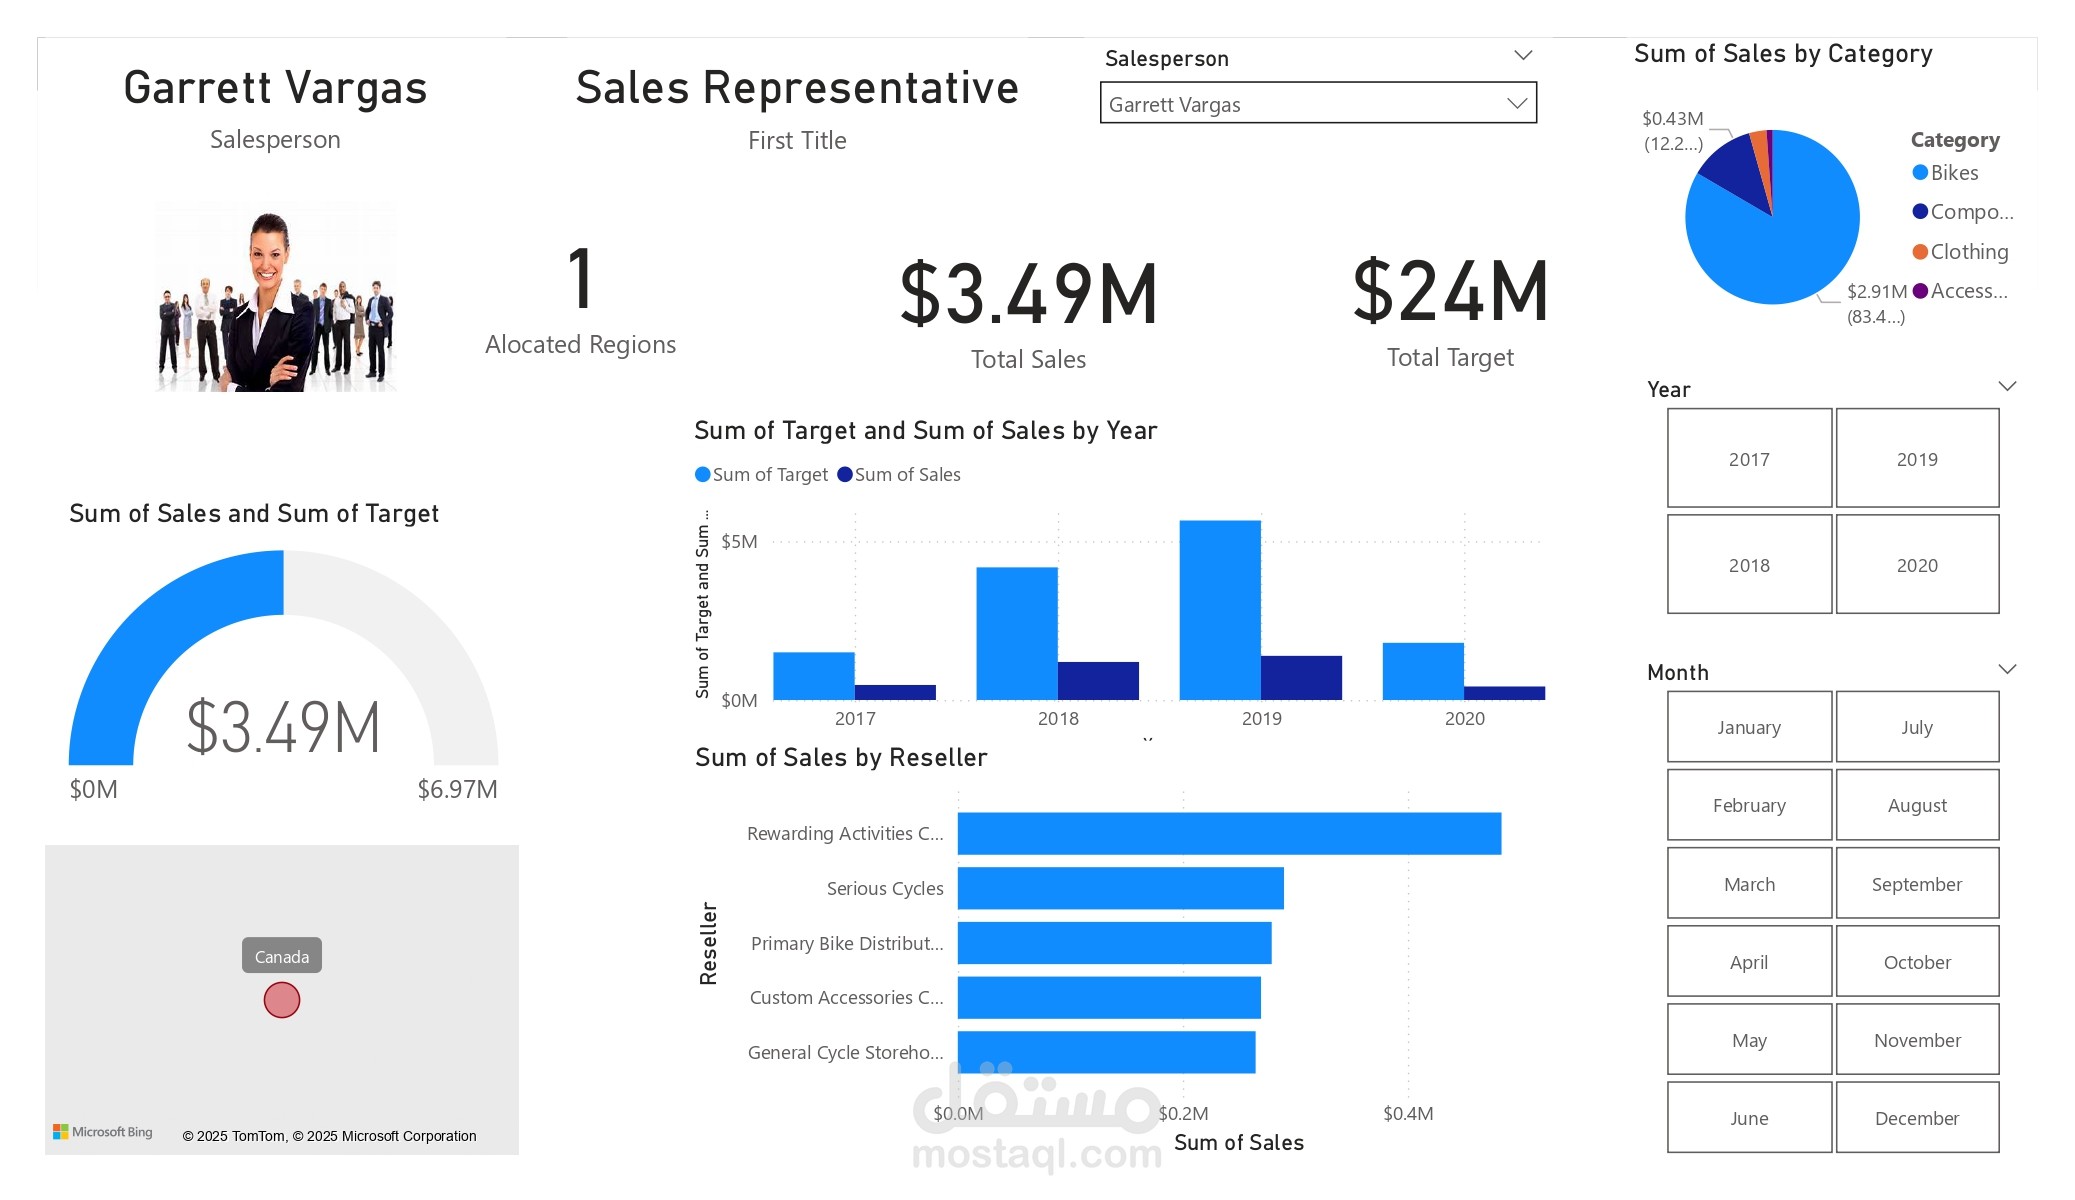


This project focuses on analyzing sales performance and evaluating salesman efficiency using Power BI and Excel. The goal is to provide deep insights into sales trends, revenue growth, and individual salesman contributions to business success.
1. Sales Analysis
Objectives:
Track total sales and revenue trends from 2011 to 2015.
Identify top-performing products and categories.
Analyze sales distribution across different regions and customer segments.
Detect seasonal trends and patterns affecting sales.
Key Insights:
Year-over-year sales growth and decline trends.
Best-selling and least-performing products.
Sales contribution by region, highlighting high- and low-performing areas.
2. Salesman Performance Analysis
Objectives:
Evaluate the performance of each salesman based on sales volume and revenue generated.
Identify top-performing sales representatives.
Compare sales targets vs. actual achievements.
Measure customer acquisition and retention by salesmen.
Key Insights:
Ranking of salesmen based on total sales and revenue.
Performance comparison by region and product category.
Identification of salesmen who need improvement and training.
Tools Used:
Excel: Data preparation, cleaning, and pivot tables for preliminary analysis.
Power BI: Interactive dashboards with KPIs, charts, and sales trends.
Final Deliverables:
Sales Dashboard: Displays revenue, product trends, and sales distribution.
Salesman Performance Dashboard: Highlights individual and team performance with rankings.
Recommendations: Insights to improve sales strategy and optimize salesman efficiency.