Desk and Beyond Dashboard
تفاصيل العمل

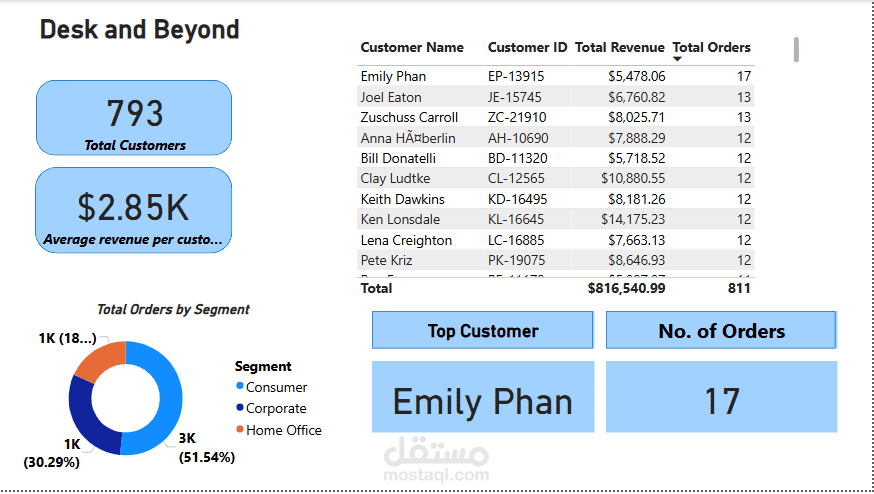
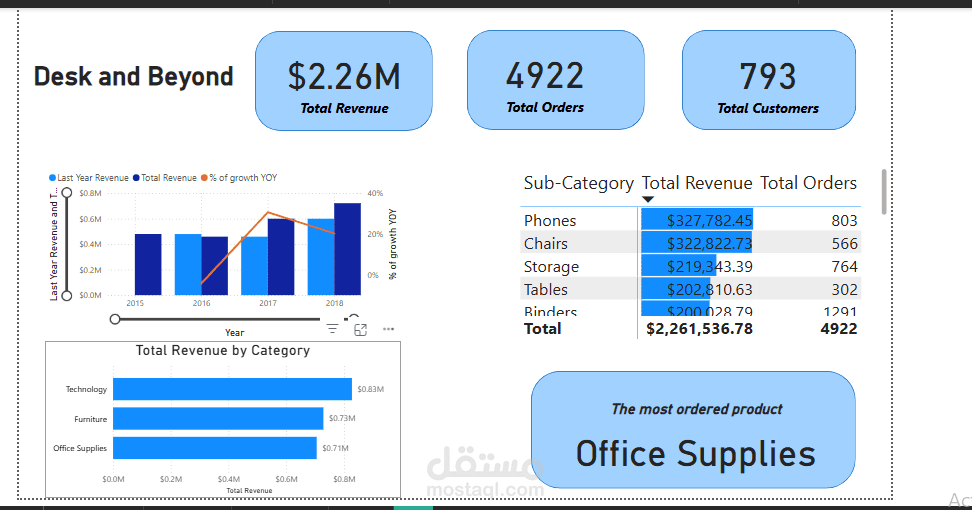
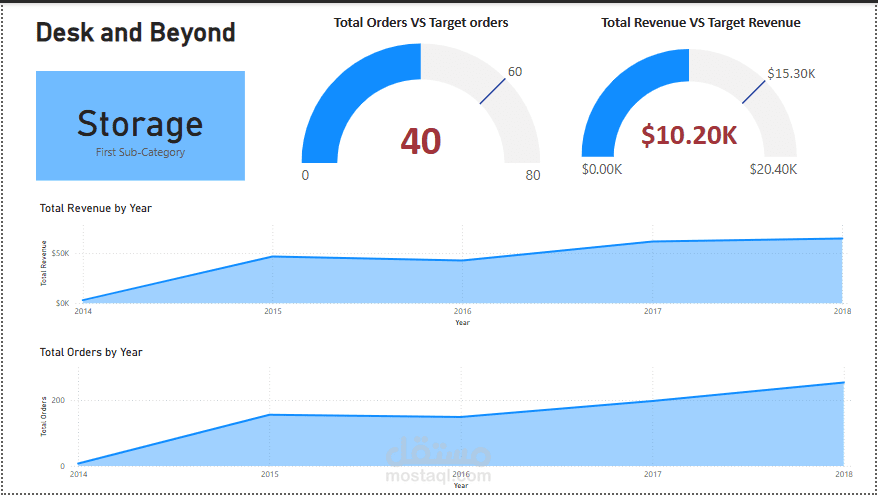
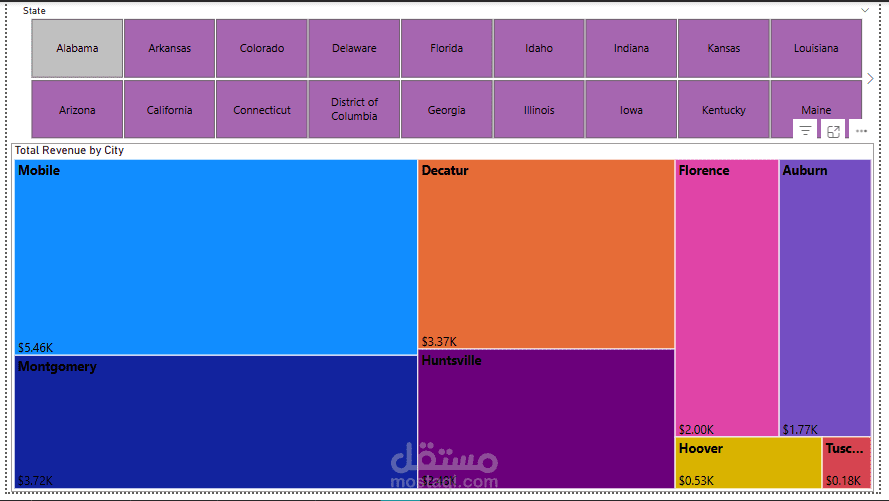
I developed a dynamic sales dashboard for tech. company to track performance & make data-driven decisions
1. Data Cleaning: Used Power Query to clean and structure tables.
2. Data Modeling: Connected multiple datasets (Orders, Customers, Products, Payments, Calendar) in Power BI
3. DAX Measures: Created key metrics such as Total Sales, Profit, Order Count, and Customer Segmentation to provide insights.
4. Interactive Visuals: Designed charts, KPIs, and slicers to enable easy filtering and analysis of sales performance across time, category, and region.