DataAnalysisWWI
تفاصيل العمل
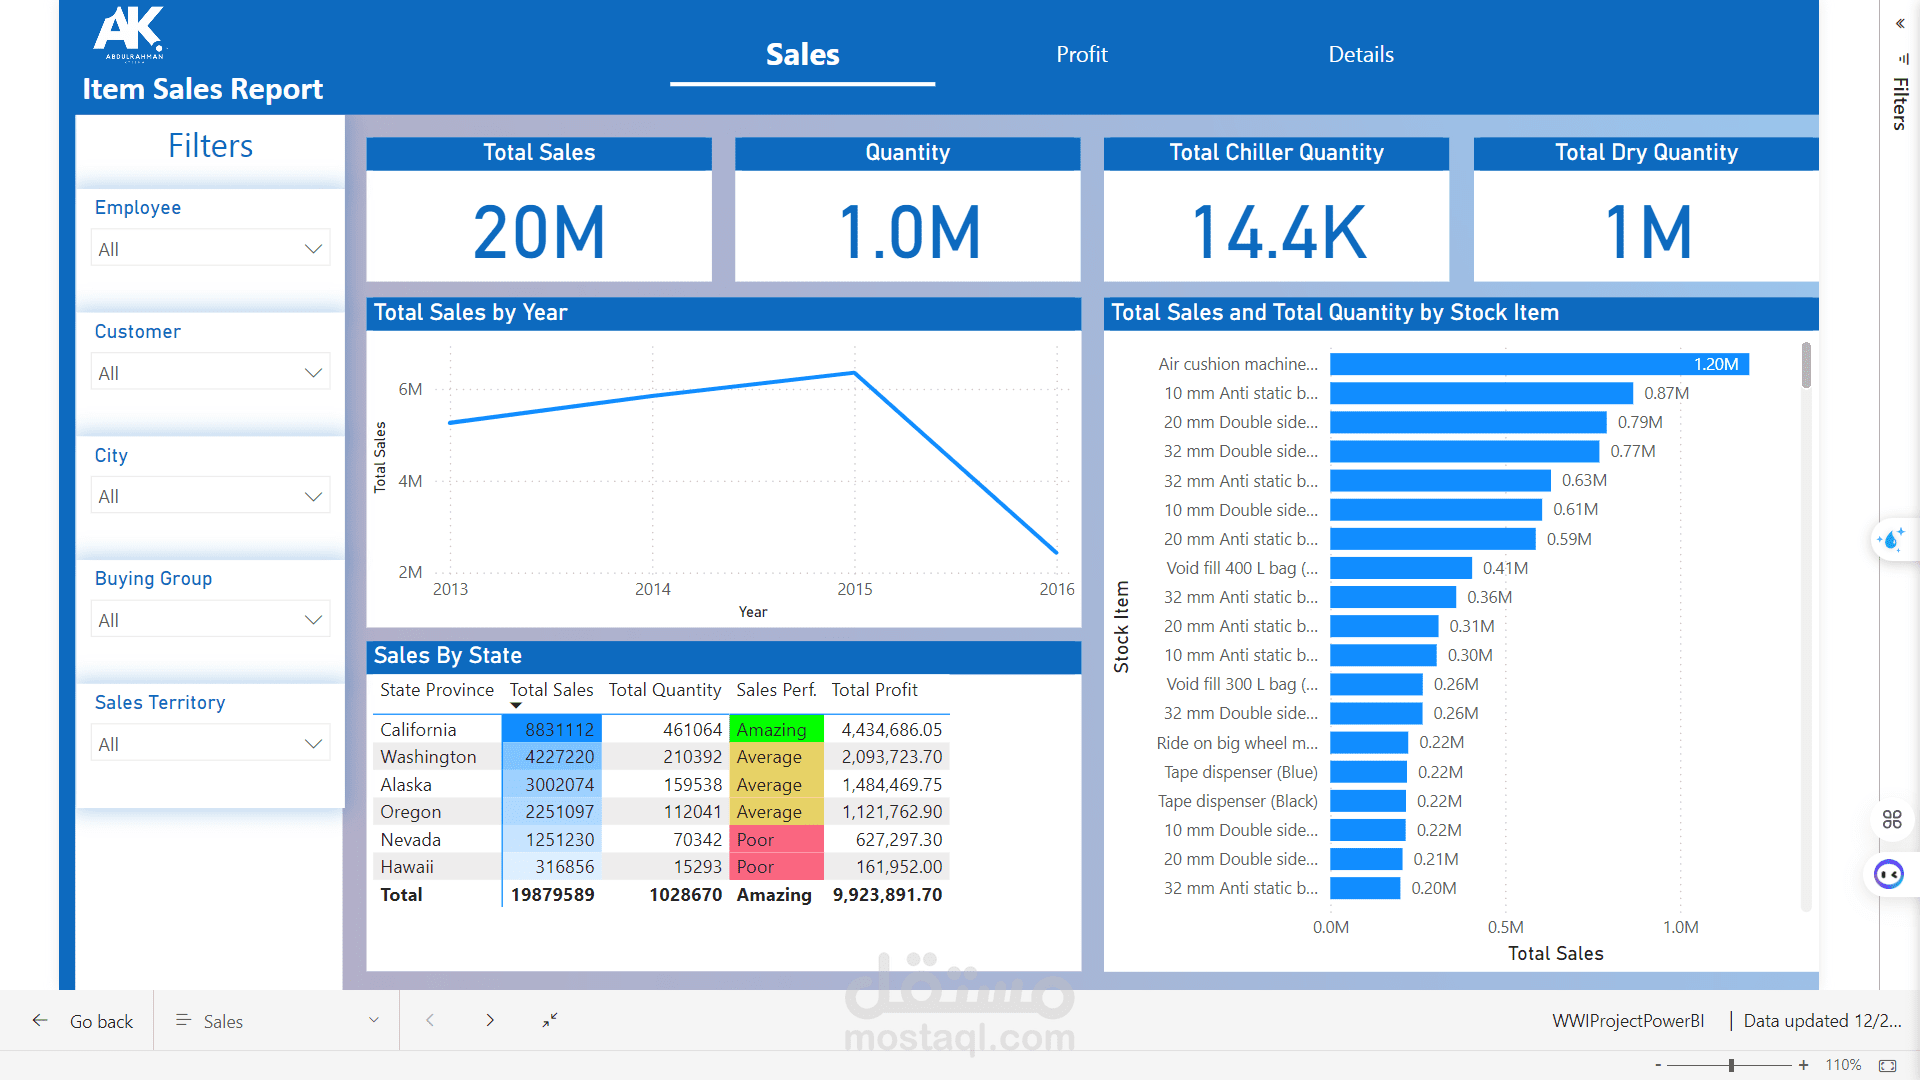
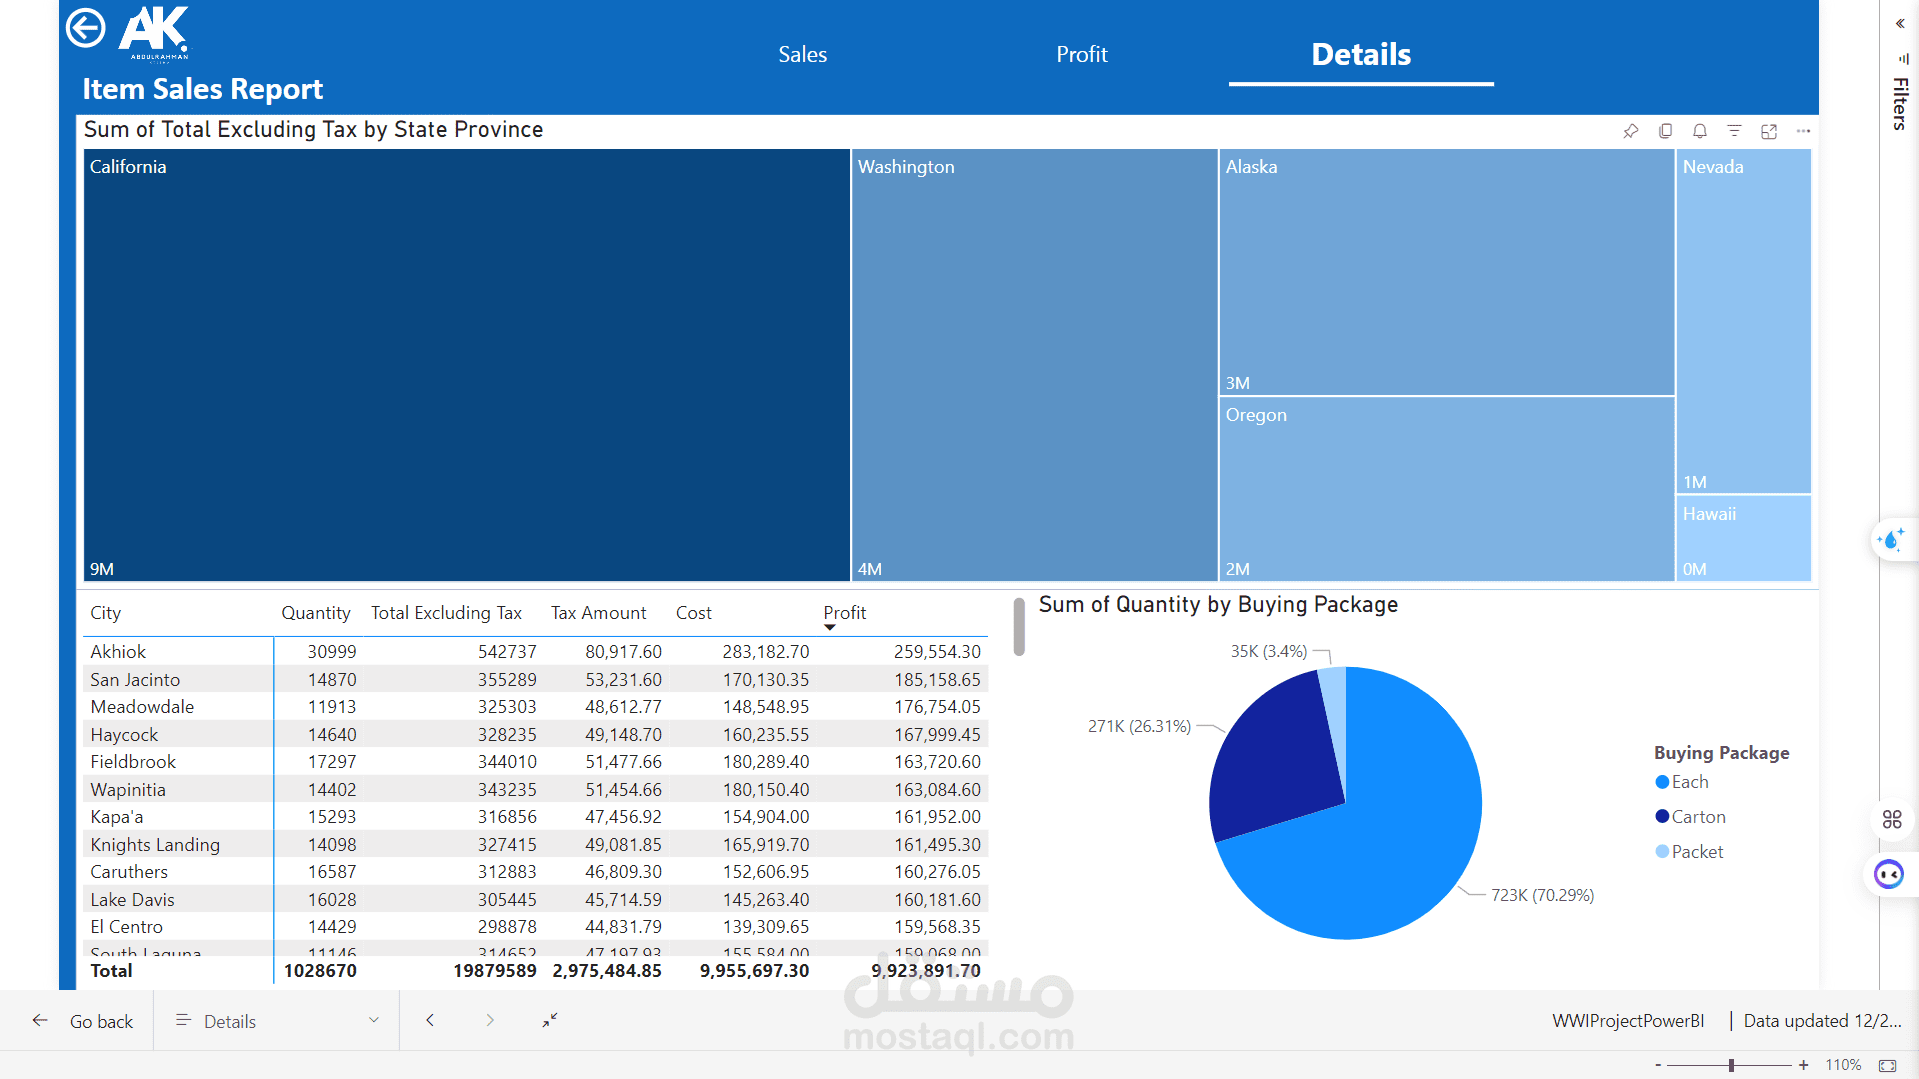
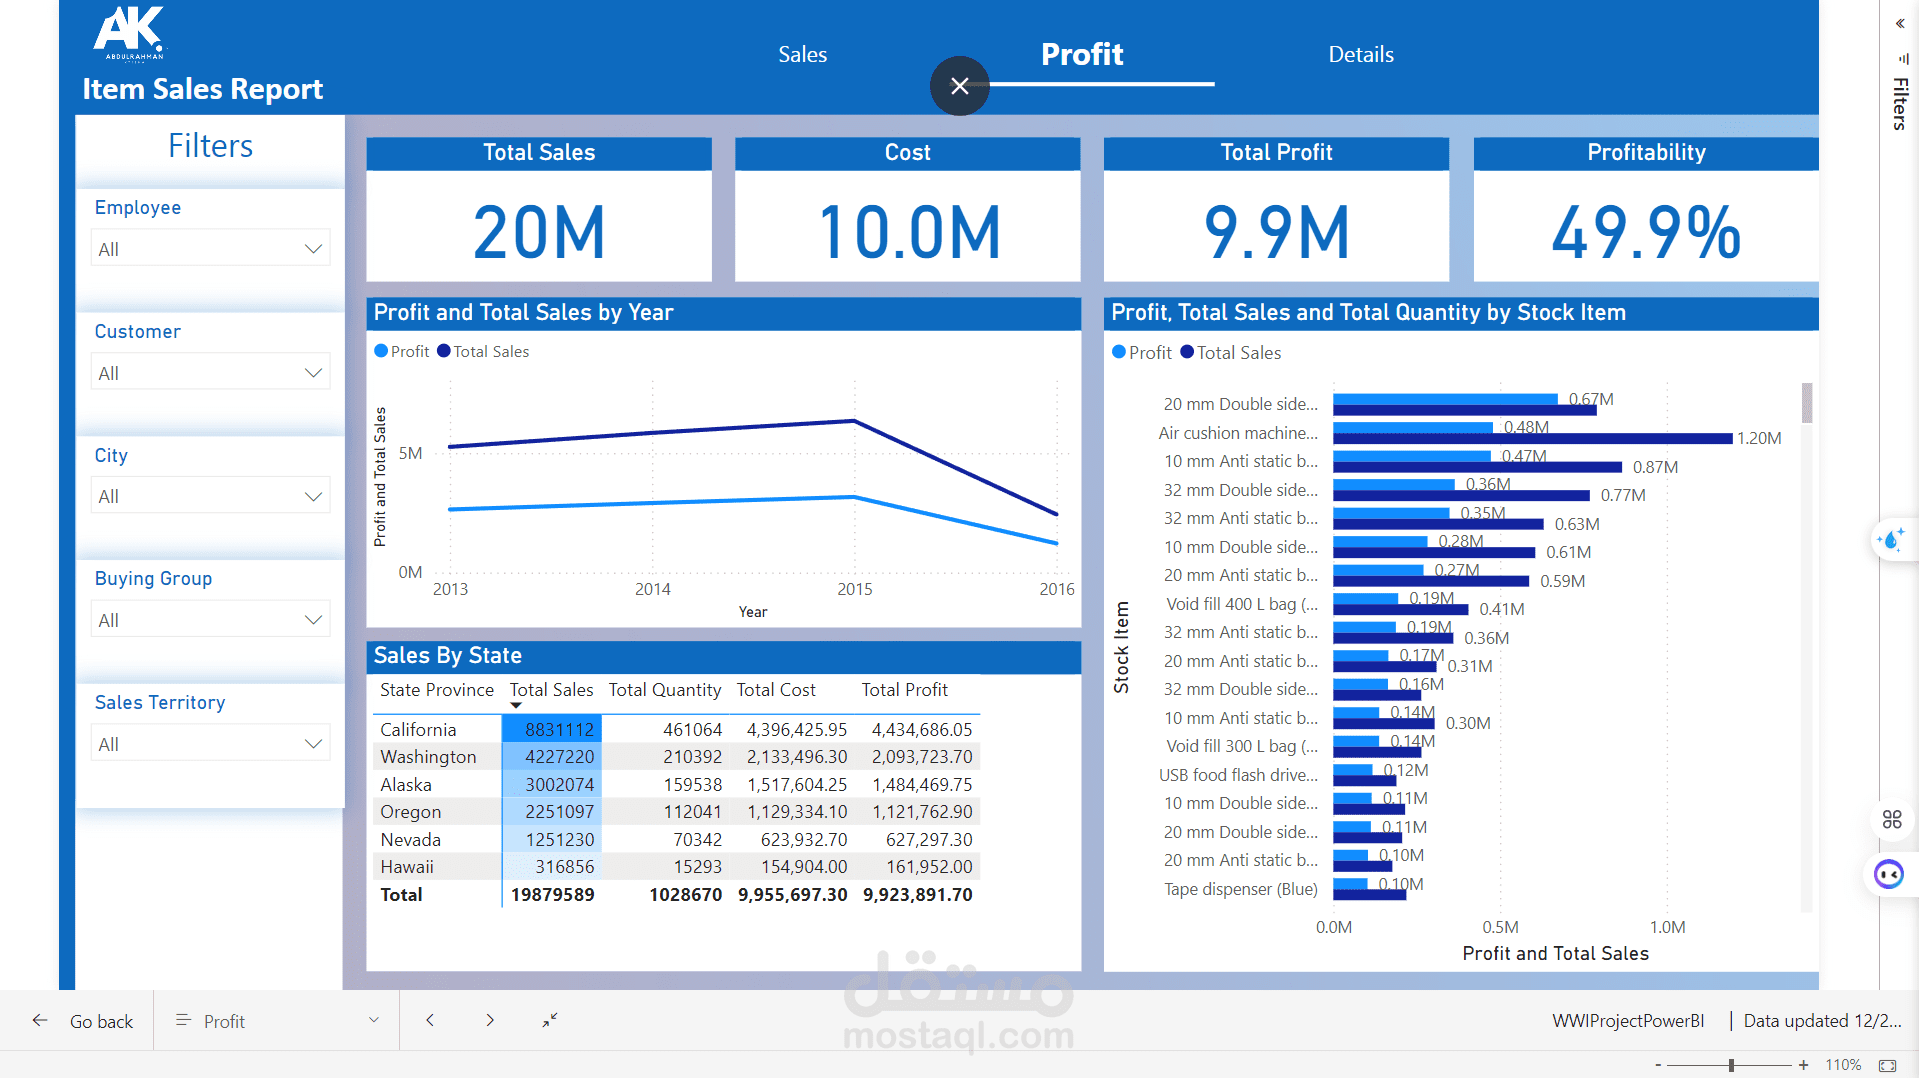

World Wide Importers Power BI Dashboard
This repository contains a Power BI dashboard designed to analyze and visualize the World Wide Importers dataset. The dashboard provides actionable insights into business performance, enabling data-driven decision-making.
Features
Interactive visualizations for sales, profits, and trends.
Advanced filtering options using slicers for better user experience.
Dynamic DAX measures to calculate KPIs and performance metrics.
Intuitive layout for easy interpretation of data.
Key Metrics
Total Sales: Comprehensive analysis of sales across regions and products.
Profitability: Insights into gross and net profit margins.
Trends: Monthly and yearly trends to monitor business performance.
Getting Started
Download the WWIProjectPowerBI.pbix file.
Open it in Power BI Desktop.
Refresh the data source if necessary.
Prerequisites
Power BI Desktop (latest version).
Data source file (ensure compatibility).
How to Use
Use slicers to filter data by date, region, or product category.
Hover over visuals for detailed insights.
Explore pre-built reports for deeper analysis.
Contact
For any questions or support, feel free to reach out via GitHub or email.