Kaggle's New York Stock Exchange S&P 500 dataset
تفاصيل العمل
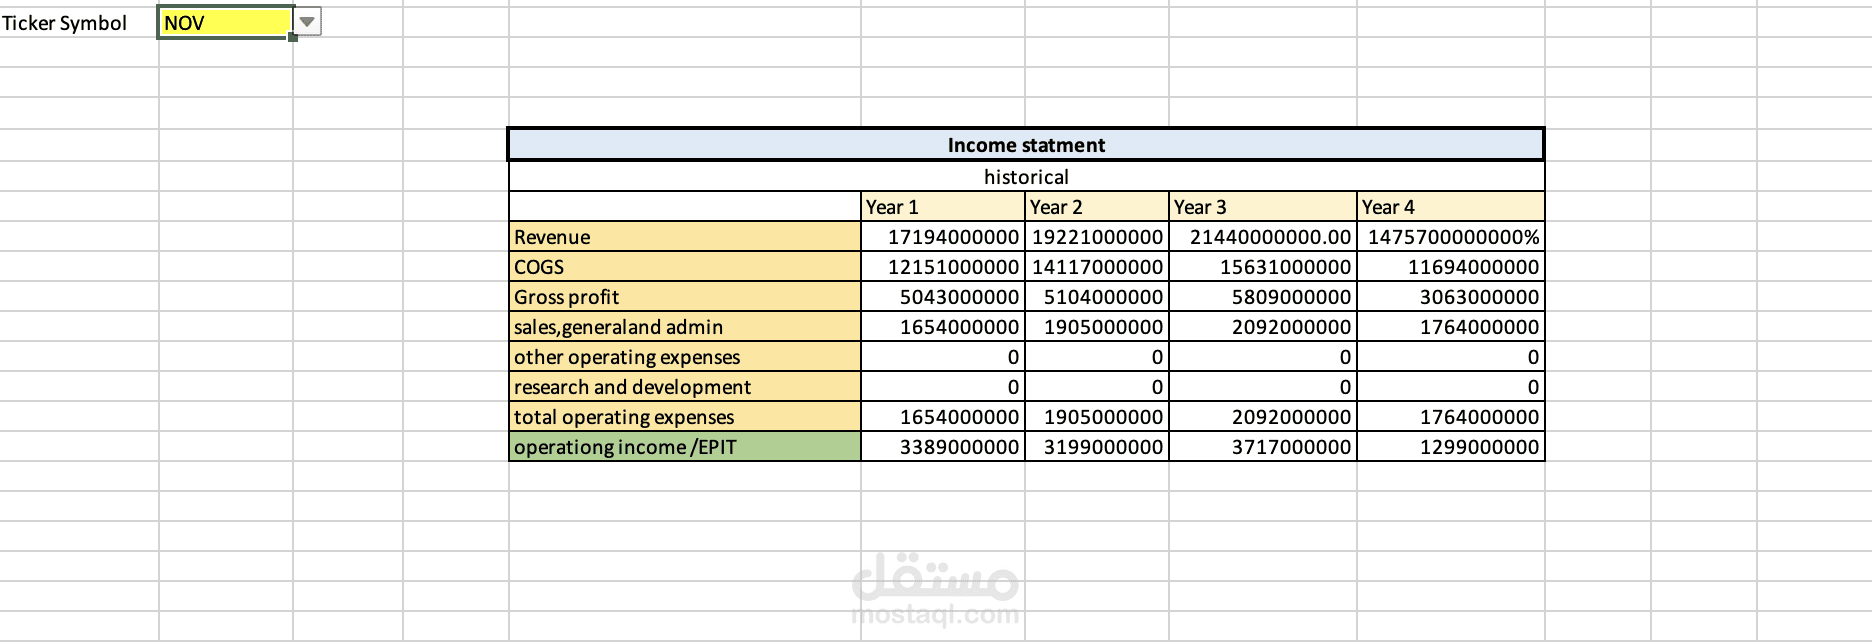
In this project, I analyzed historical financial data from S&P 500 companies, focusing on the banking subsector. The dataset contained 1,710 rows and 10 columns, covering a four-year period. My analysis involved three key tasks:
Exploratory Data Analysis (EDA) Using Visuals – I examined revenue trends across 10 major banks, assessing data distribution and variability. Using pivot tables and statistical measures (mean, median, standard deviation), I identified stable performers like BAC, JPM, PNC, and BBT, which showed minimal revenue fluctuations.
Profit and Loss Statement Dashboard – I structured financial insights into a dynamic dashboard, highlighting key revenue trends.
Forecast Modeling – I applied growth rate calculations to project future performance. For revenue growth, I used the formula:
(
F
11
/
C
11
)
(
1
/
3
)
−
1
(F11/C11)
(1/3)
−1
where F11 represents the fourth-year revenue and C11 the first-year revenue.
Key insights revealed that stable banks had close mean and median values, while others, like KEY and PNC, experienced revenue spikes. This analysis provided a clear understanding of financial trends and bank performance over time.