marketing dashboard (Power BI)
تفاصيل العمل

I had a marketing project, where I leveraged data analysis to unveil critical insights that enhance operational efficiency.
- The Journey Begins with Data Exploration:
My process started with a comprehensive examination of our data, identifying key performance indicators (KPIs) such as:
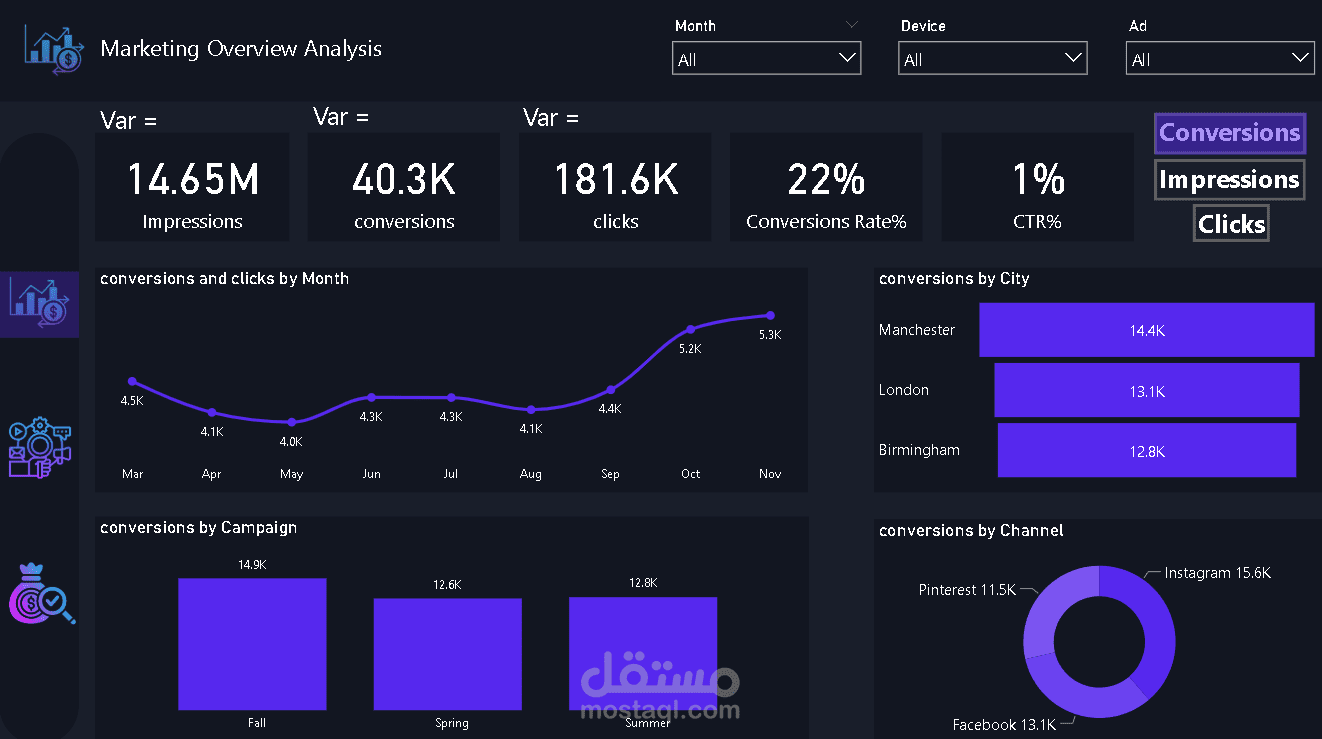
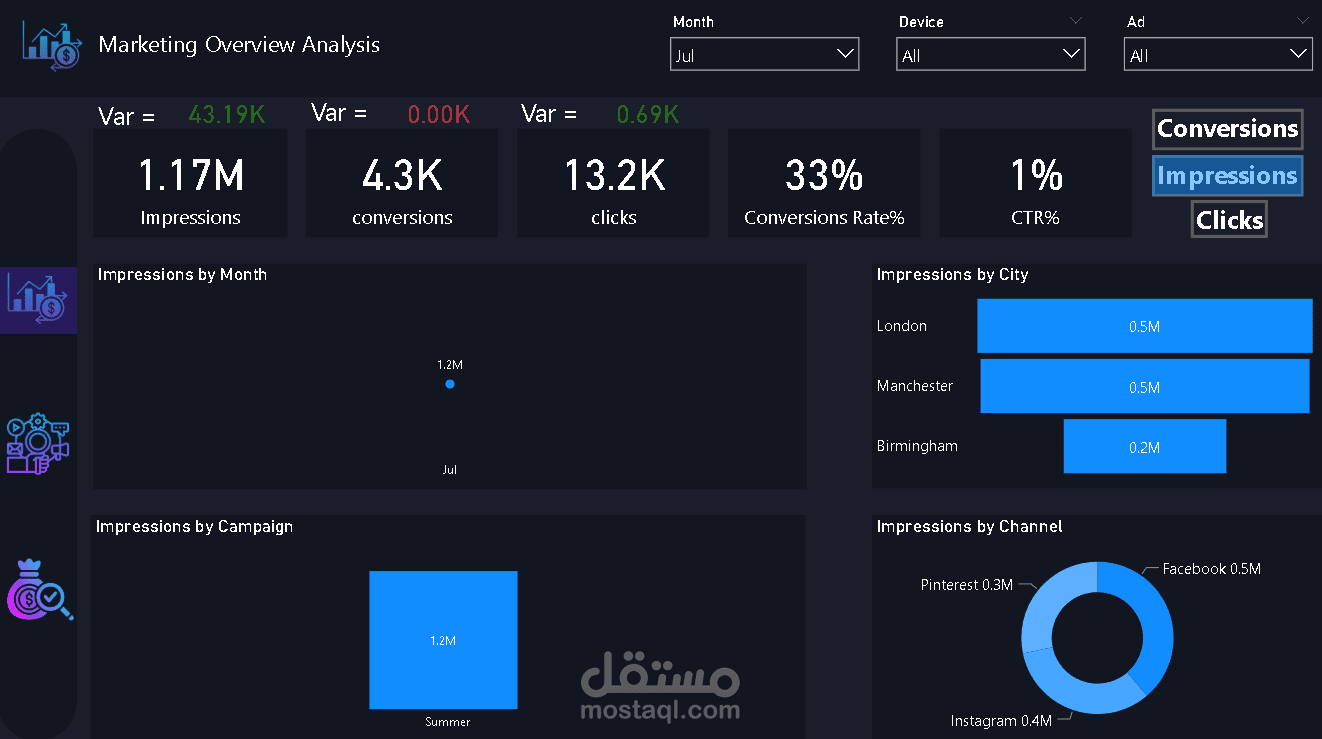
• Impressions
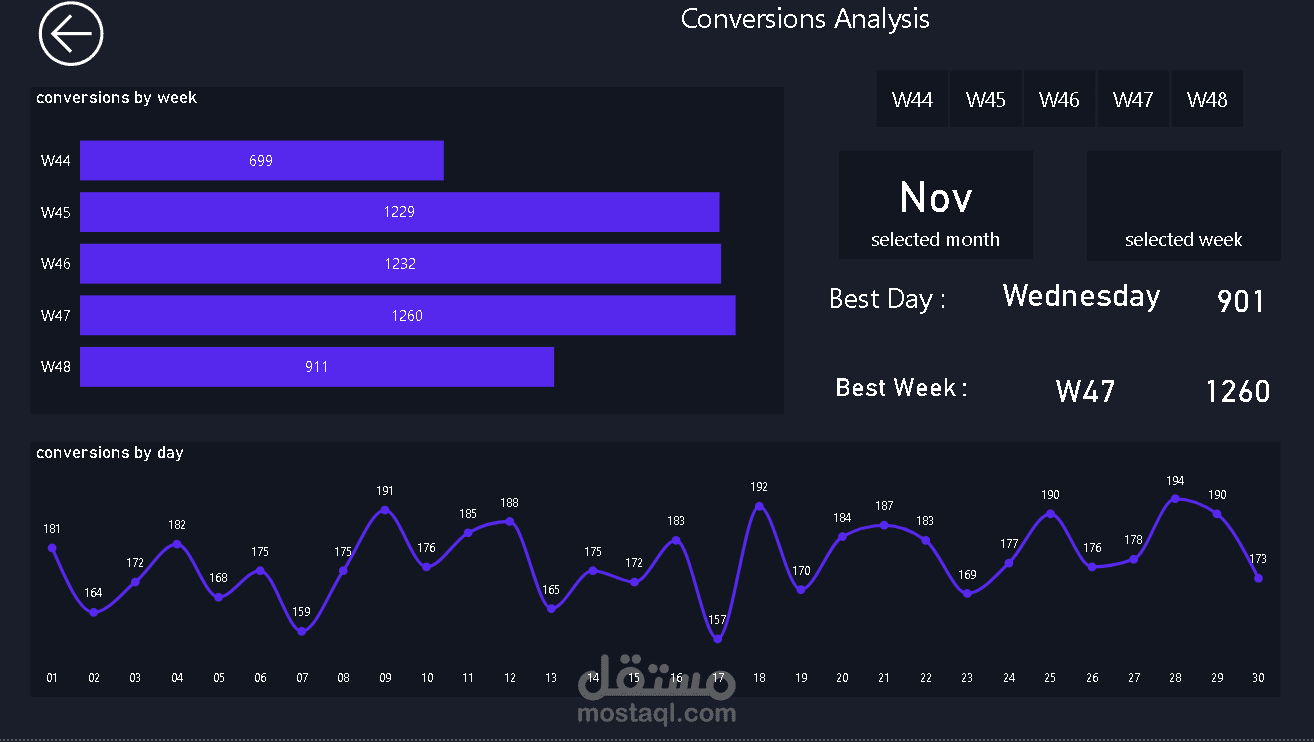
• Conversions
• Clicks
• Conversion Rate%
• CTR%
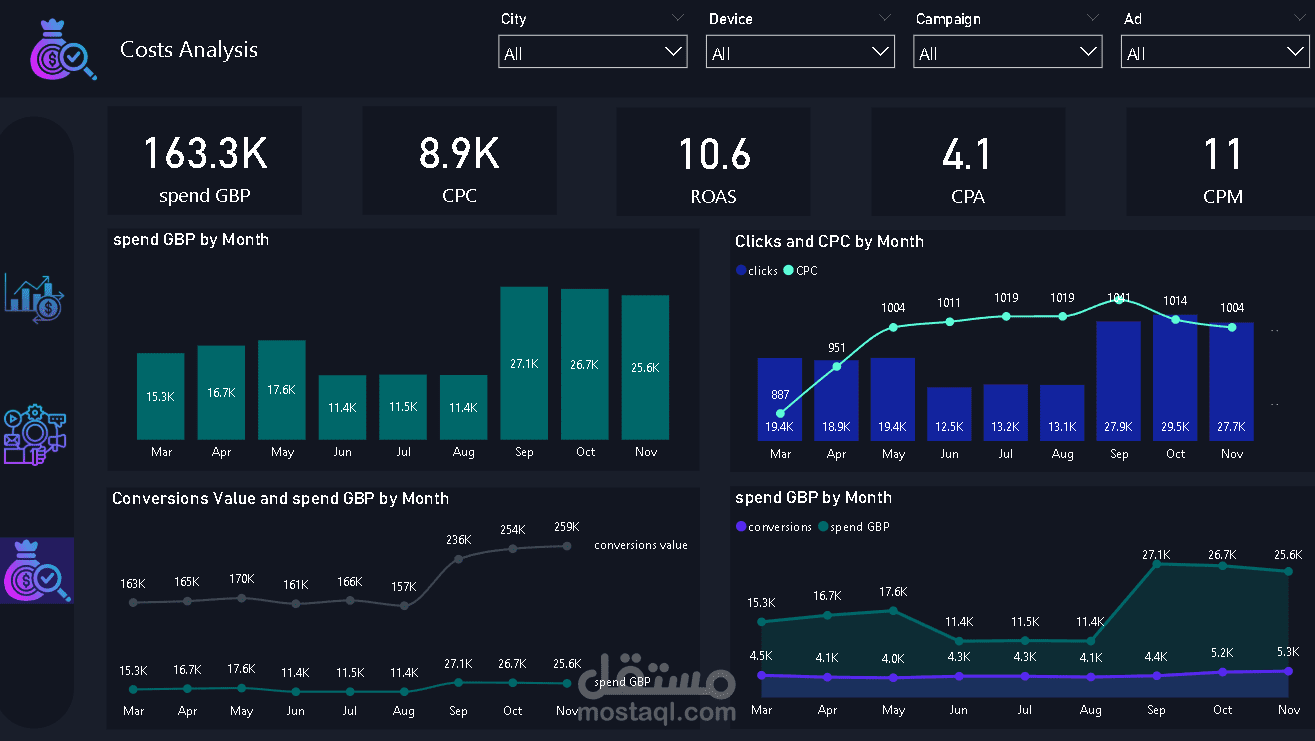
• ROAS
• CPA
• CPM
• CPC
• Total Spend
- Crafting a Dashboard Mockup:
From there, I created an engaging dashboard mockup using Sketch to visualize these insights effectively.
- Next Steps: Data Transformation & Analysis:
We’re now ready to initiate the ETL process in Power Query, establish relationships within our data model, and conduct DAX calculations.
- Dynamic Dashboard Integration:
I have successfully integrated all components to design a dynamic, interactive dashboard that reveals valuable trends.
- Some Key Insights & Observations:
• We have best results during the fall season in October and November in Manchester and London and Discount ad.
• Additionally, I recommend Focusing on Pinterest and Instagram as:
• The highest ROAS channel is Pinterest.
• The highest CPA channel is Facebook.
• Instagram leads in conversions.
• Facebook has the highest spend in GBP.
• Pinterest achieved the best conversion rate.
• and noted that:
• The best conversion rate occurs in the summer.
• The highest ROAS is also during the summer.
• so I recommend giving opportunity for increasing spending in that season.