financial dashboard (Power BI)
تفاصيل العمل

I had a finance project where I leveraged my data analysis skills to uncover actionable insights.
I started by reading the data.
Next, I extracted key performance indicators (KPIs) such as:
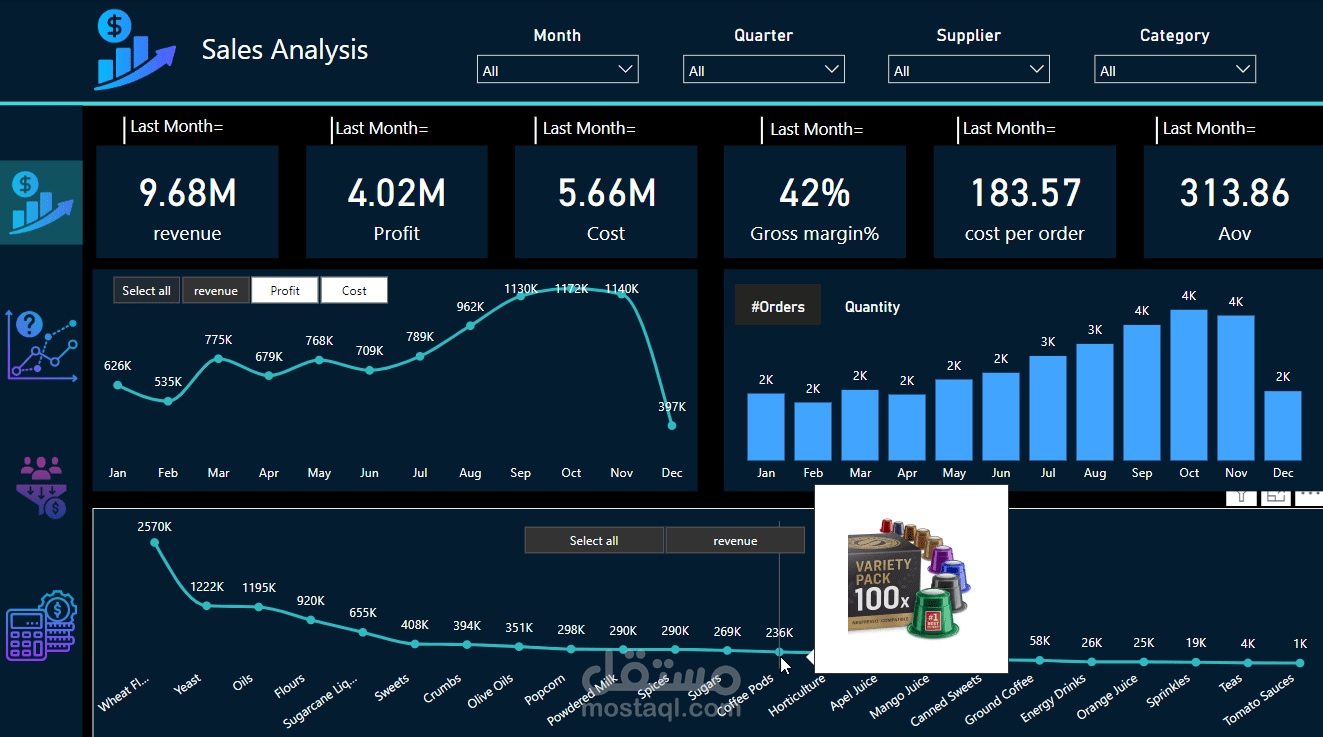
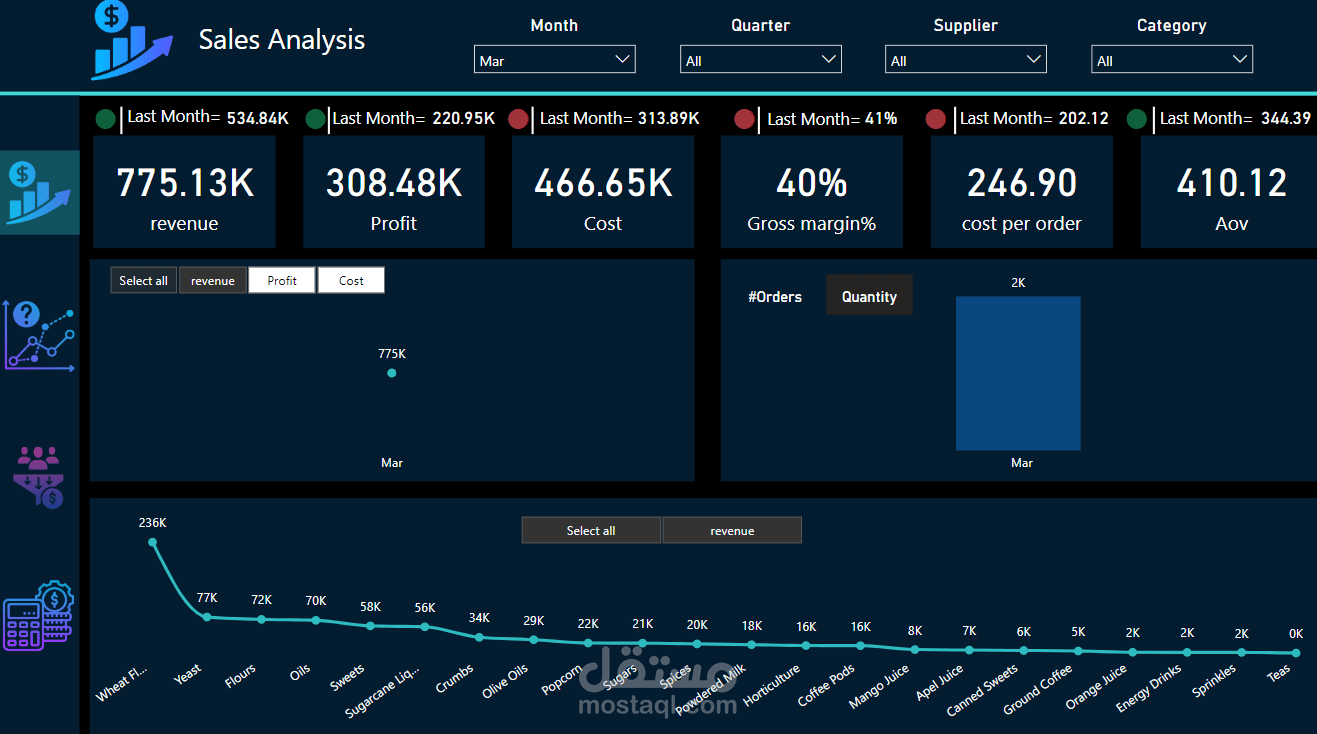
• Revenue
• Profit
• Cost
• Gross Margin (GM)
• Cost Per Order (CPO)
• Average Order Value (AOV)
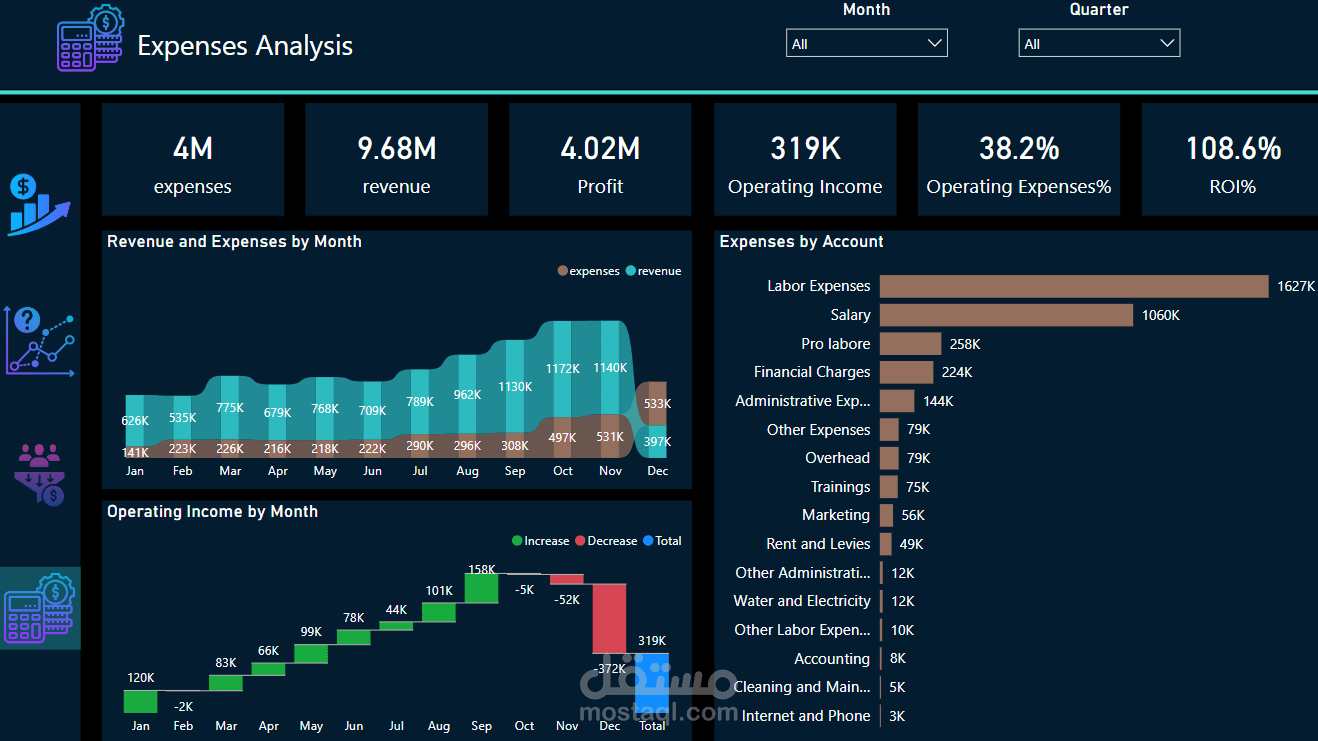
• Operating Income
• Operating Expenses
• Return on Investment (ROI)
Afterward, I created a dashboard mockup using sketch.
Now, we can begin the ETL process in Power Query, establish relationships in the data model, and perform DAX calculations.
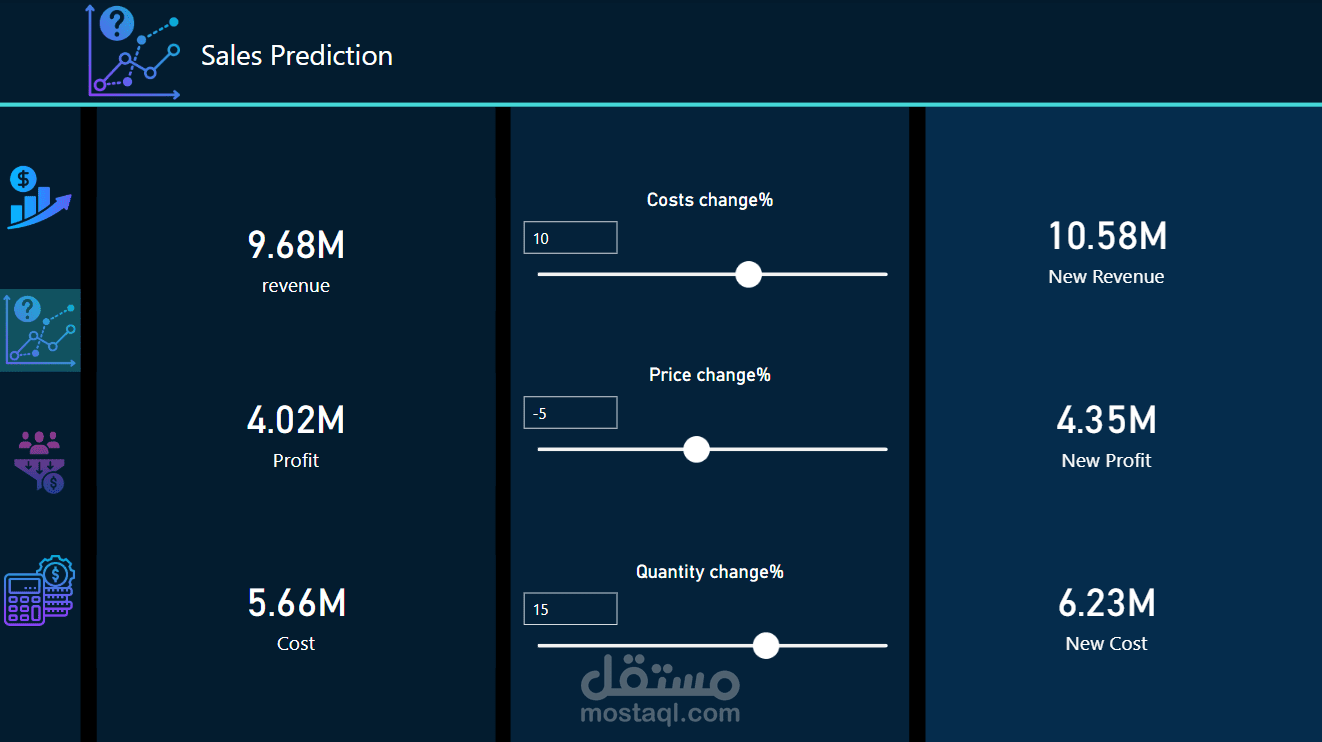
Finally, I've integrated all these elements to produce a dynamic dashboard.
One of the most crucial aspects is the data observations; here are some insights:
1.We have a product, Yeast, that generates more profit than its cost and ranks as the second highest in revenue. I recommend focusing more on Yeast, with September being its most successful month.
2.There is a significant drop in December when comparing revenue and expenses.
3.October shows our highest revenue and profit, but the elevated expenses resulted in negative operating income.