Product-Sales
تفاصيل العمل
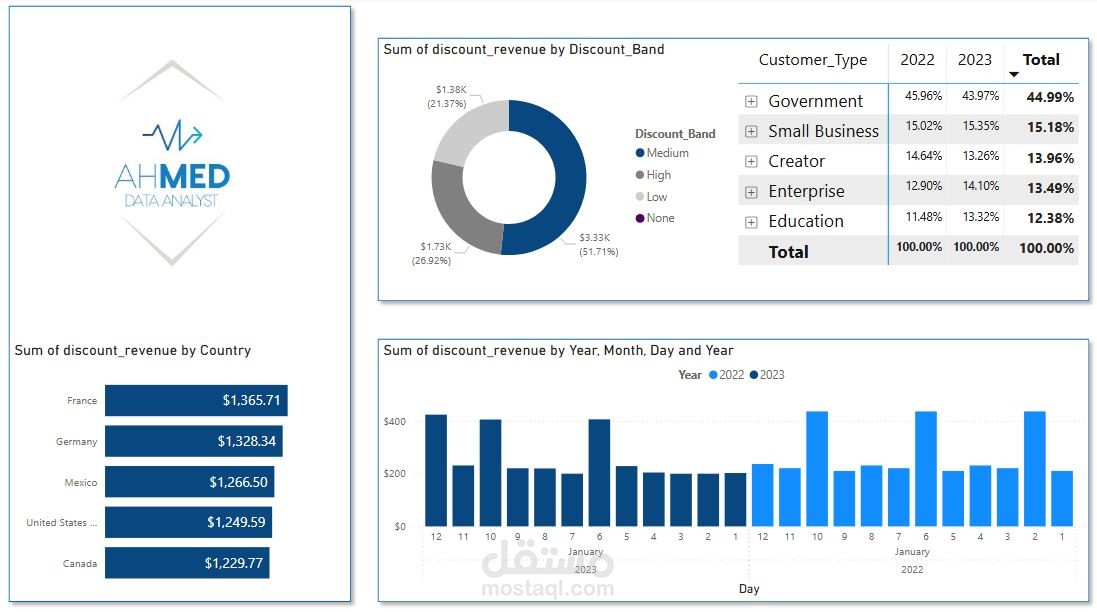
Today I'm going to participate in the first Dashboard report, will be the first interactive dashboard by SQL and PowerBi.
Analysis of product sales .
What is included in the analysis:
1. Building a database
2. SQL development
2. Contact my authority
3. Creating a dashboard
4. DAX formula
What showed:
1.Revenue tracking
2.Profits
3.Trends
- Regional Performance displaying sales and profit by regions for comparison purposes.
As a result of thisproject, I learned a great deal more about data visualization, and data and graphic interaction which are valuable skills for a data manager.
If you’re interested in developing this kind of dashboard and/or analyzing your data, please don’t hesitate to get in touch – it would be great to exchange opinions, and I’d like to hear what is done in this area by other specialists!
Check all the details on GitHub- the completed project:
# Files
- PowerBi Dashboard.xlsx - The main Excel file containing the sales dashboard.
- Dashboard.png - A snapshot of the dashboard for quick reference.
# Requirements
- Microsoft Excel: the dashboard uses Power Query and slicing, so it is recommended to use Excel 2021 .
- Microsoft PowerBi: the dashboard uses Power Query and slicing, so it is recommended to use PowerBi 2025 .
- Microsoft SQL: the dashboard uses SQL queries and slicing, so it is recommended to use SQL 2025 .
# License
This project is open-source and available under the MIT License.
