https://github.com/AhmedAbdulrahmann/Product-Sales
تفاصيل العمل
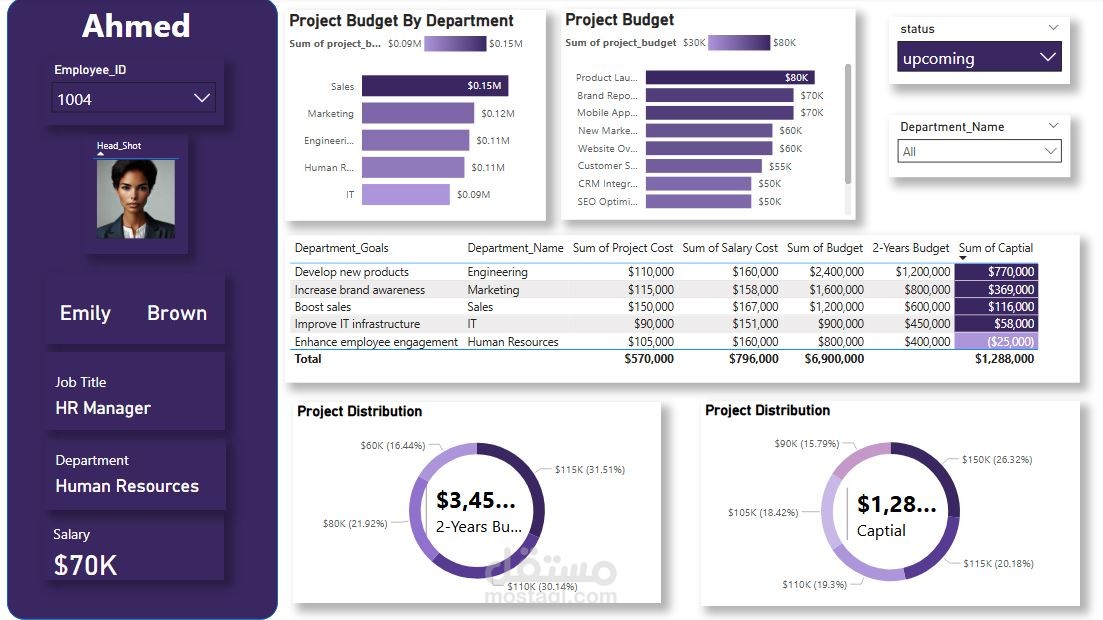
I will share the dashboard and hope you like it, the dashboard will be interactive by SQL and powerby.
Analysis of Project-tracking.
What is included in the analysis:
1. Building a database
2. SQL development
2. Contact my authority
3. Create a dashboard
4. DAX formula
What showed:
1.Salary data
2.Understand which departments or projects have exceeded the budget
3.Employee information
4.Identification of departments and projects
5.Department budgets
6.Project details
7.Which projects and departments are at risk of exceeding the budget or poor performance
As a result of this project, I learned a lot about data visualization, data and graphical interaction which are valuable skills for a data manager.
Check check out all the details about the finished GitHub project:
# Files
- PowerBi dashboard.The main file that contains an information panel .
- The dashboard.PNG-screenshot of the dashboard for quick reference.
# Requirements
- Microsoft PowerBi: the dashboard uses pivot tables and slicing, so it is recommended to use PowerBi 2025 .
# License
This project is open source and available under license from the Massachusetts Institute of technology.
If you are interested in developing this type of dashboard and/or analyzing your data, please do not hesitate to contact – it would be great to exchange opinions, I would like to hear what is being done in this area by other specialists!
