Airbnb-Properties-Information
تفاصيل العمل
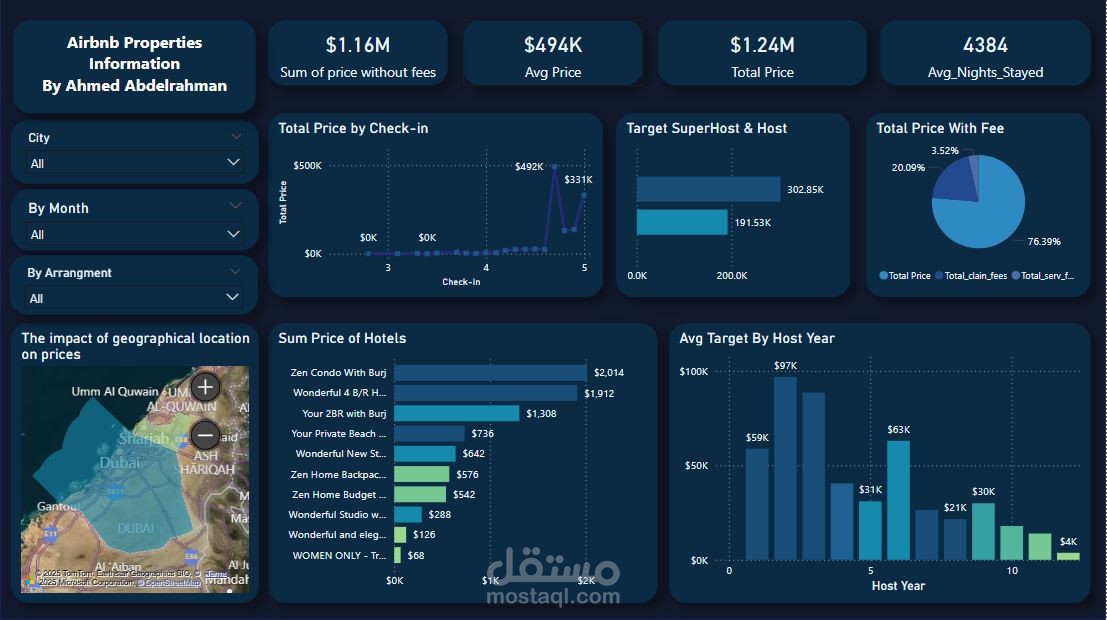
I hope you're all right . Today I am going to share a project with you and I want to see any comment, whether positive or negative, positive, I will be grateful, negative, I will also be grateful and I will work with your comment in order to improve my work in the next period.
1- I downloaded the data from the brightdata website .
2- This data belongs to the well-known Aribnb .
#What's been done .
- I have partially cleaned the data in the Excel program .
- clean the other part using SQL .
- enter the data to PowerBi using Import from SQL Queries .
- work on arranging the data using Power Query .
- DAX formulas .
#What was extracted .
- How prices and valuations have changed over time .
- Analysis of the length of stay and bookings .
- average number of nights booked .
- impact of geographical location on prices .
- most areas that contain real estate .
- most expensive and cheapest real estate .
- effect of fees on the total price .
- difference in prices between new and old hosts .
As a result of this project, I learned a lot about data visualization, data and graphical interaction which are valuable skills for a data manager.
If you are interested in developing this type of dashboard and/or analyzing your data, please do not hesitate to contact – it would be great to exchange opinions, I would like to hear what is being done in this area by other specialists!
Check check out all the details about the finished GitHub project:
# Files
- PowerBi dashboard.The main file that contains an information panel .
- The dashboard.PNG-screenshot of the dashboard for quick reference.
# Requirements
- Microsoft Excel: the dashboard uses Power Query and slicing, so it is recommended to use Excel 2021 .
- Microsoft PowerBi: the dashboard uses Power Query and slicing, so it is recommended to use PowerBi 2025 .
- Microsoft SQL: the dashboard uses SQL queries and slicing, so it is recommended to use SQL 2025 .
# License
This project is open source and available.
