تقرير مبيعات
تفاصيل العمل
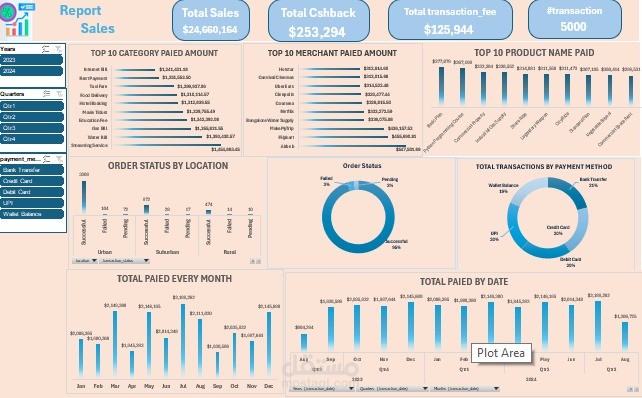
Data analysis is the key to smarter decision-making!
I designed this interactive sales dashboard in Excel, providing a comprehensive overview of:
Total sales, cashback, and transaction fees
Top-performing categories, merchants, and products
Order distribution by location and payment method
Payment trends by month and day, with collapsible reports based on date and location ️
To enhance interactivity, I implemented Slicers, allowing users to filter and explore data dynamically for better insights!