E-Commerce Project
تفاصيل العمل

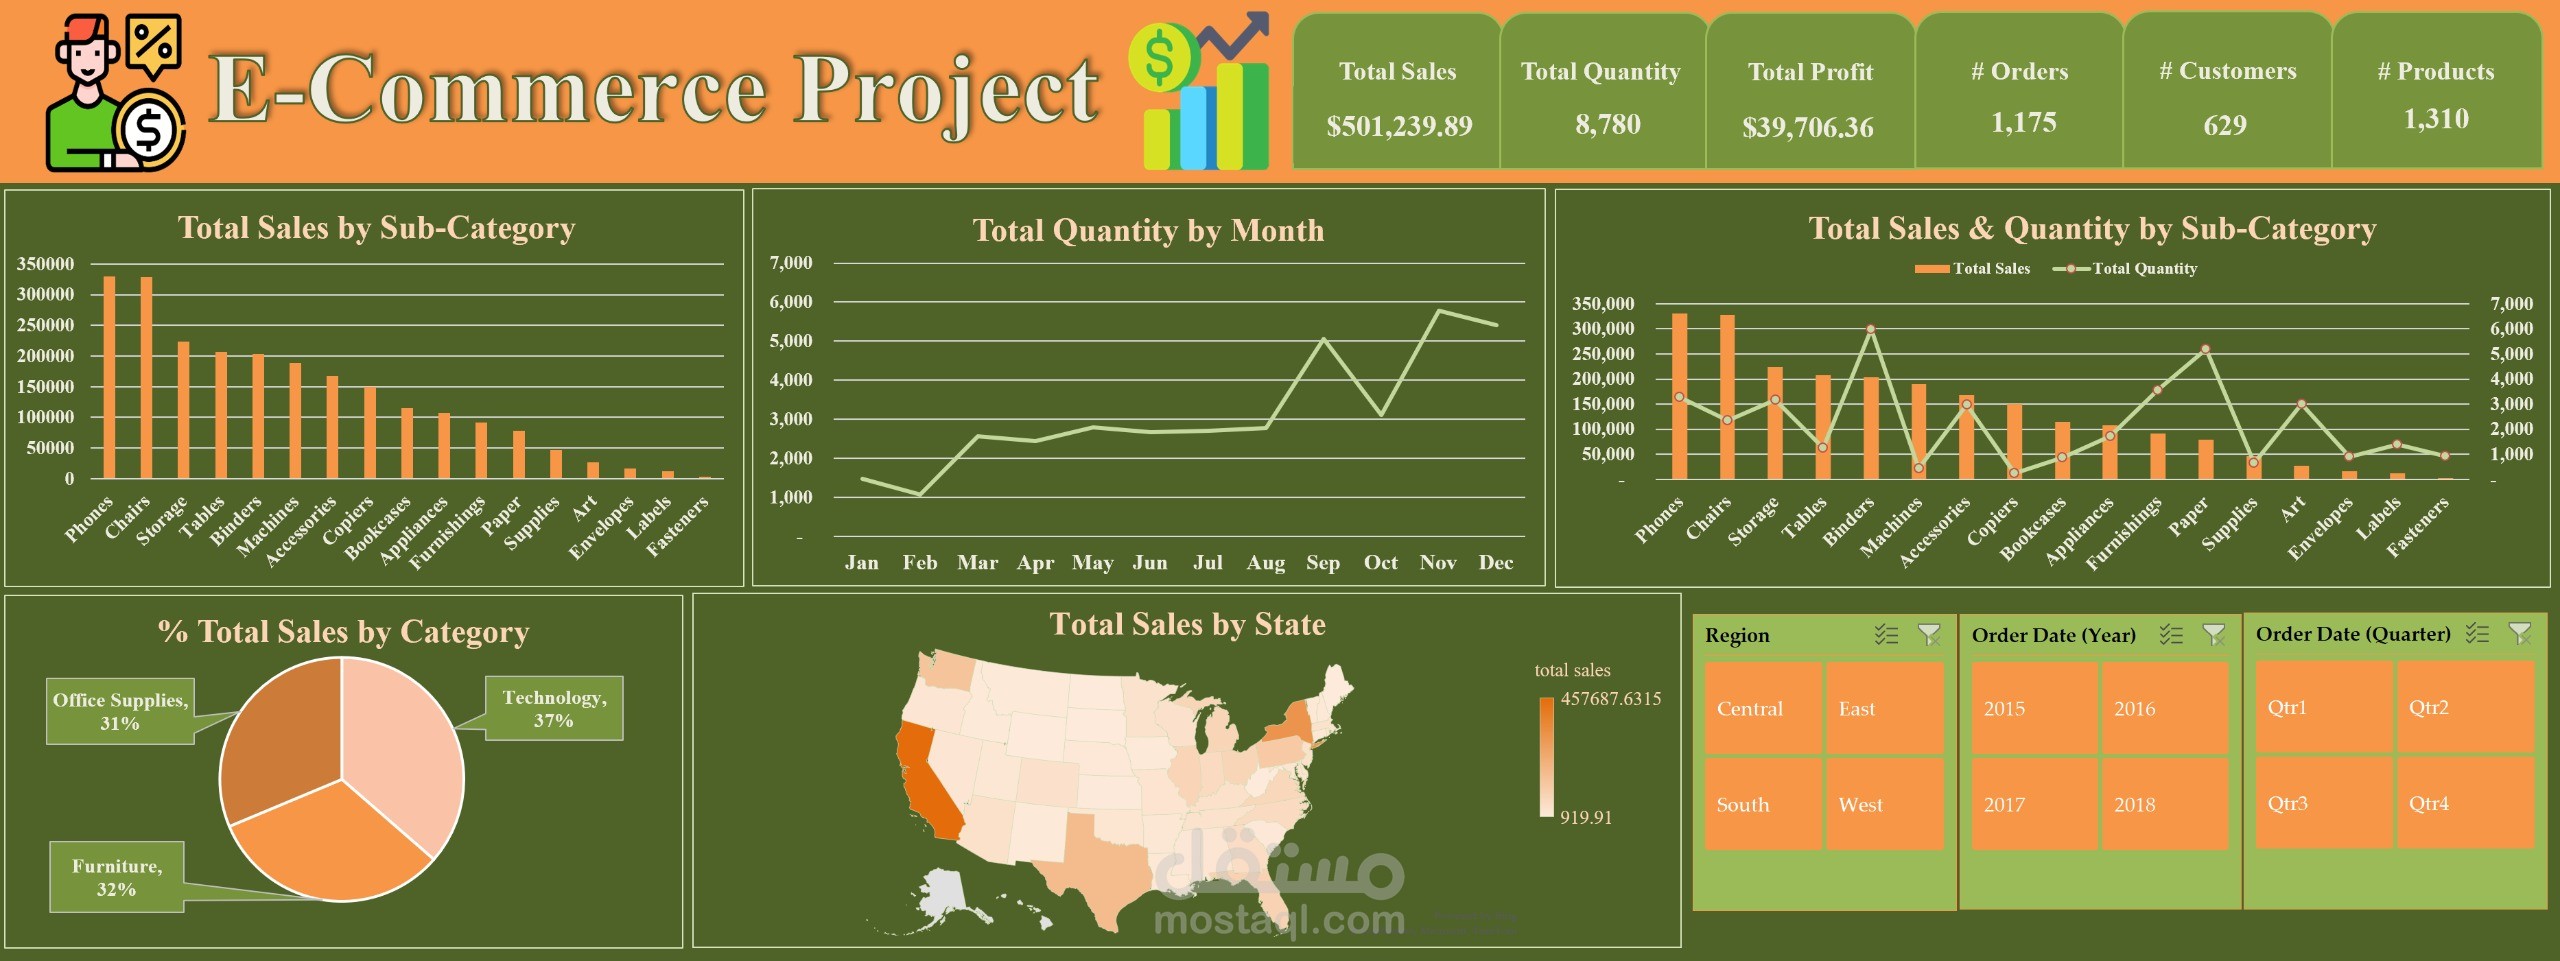
This E-Commerce Project dashboard analyzes key metrics like sales, profit, orders, and customers. It highlights top-performing products (e.g., phones, chairs), category contributions (Technology 37%, Furniture 32%, Office Supplies 31%), and sales trends across regions and time. Geographical insights show California as a top contributor. The dashboard helps decision-makers track performance, understand trends, and optimize strategies for growth and profitability.