Road Accident Dashboard
تفاصيل العمل
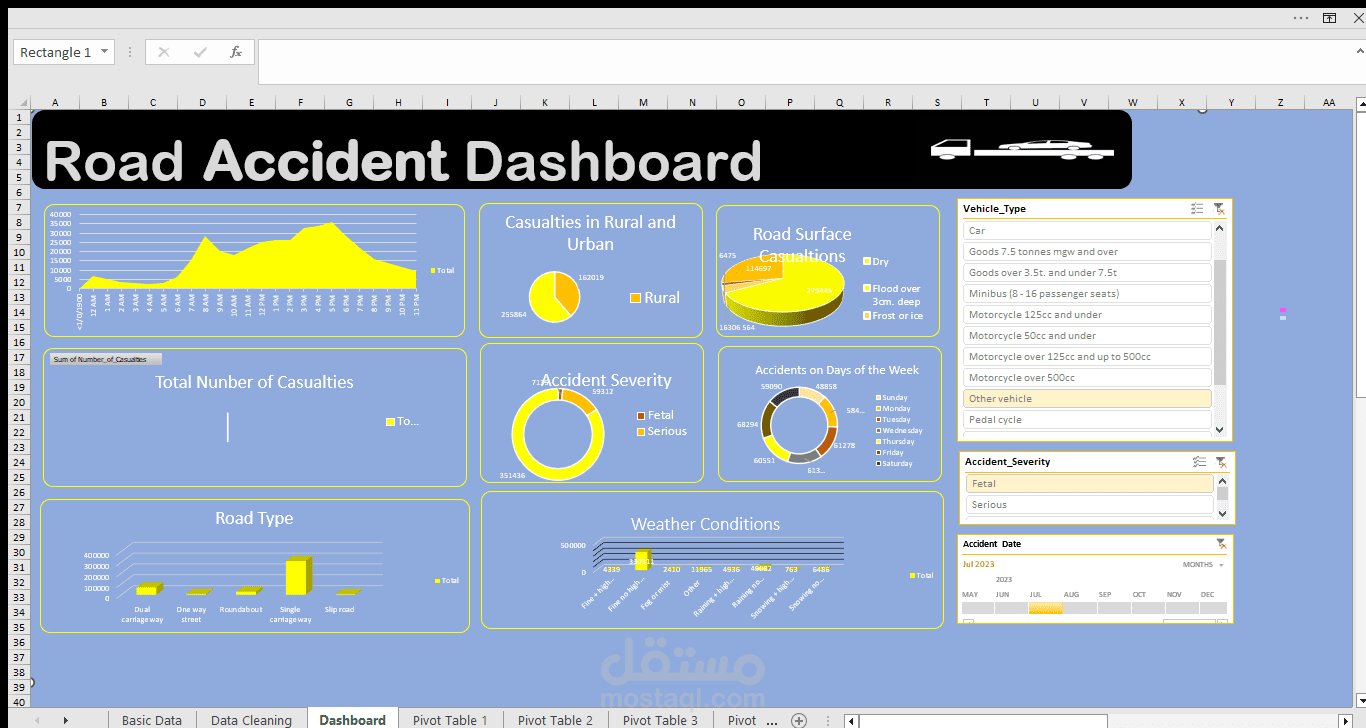
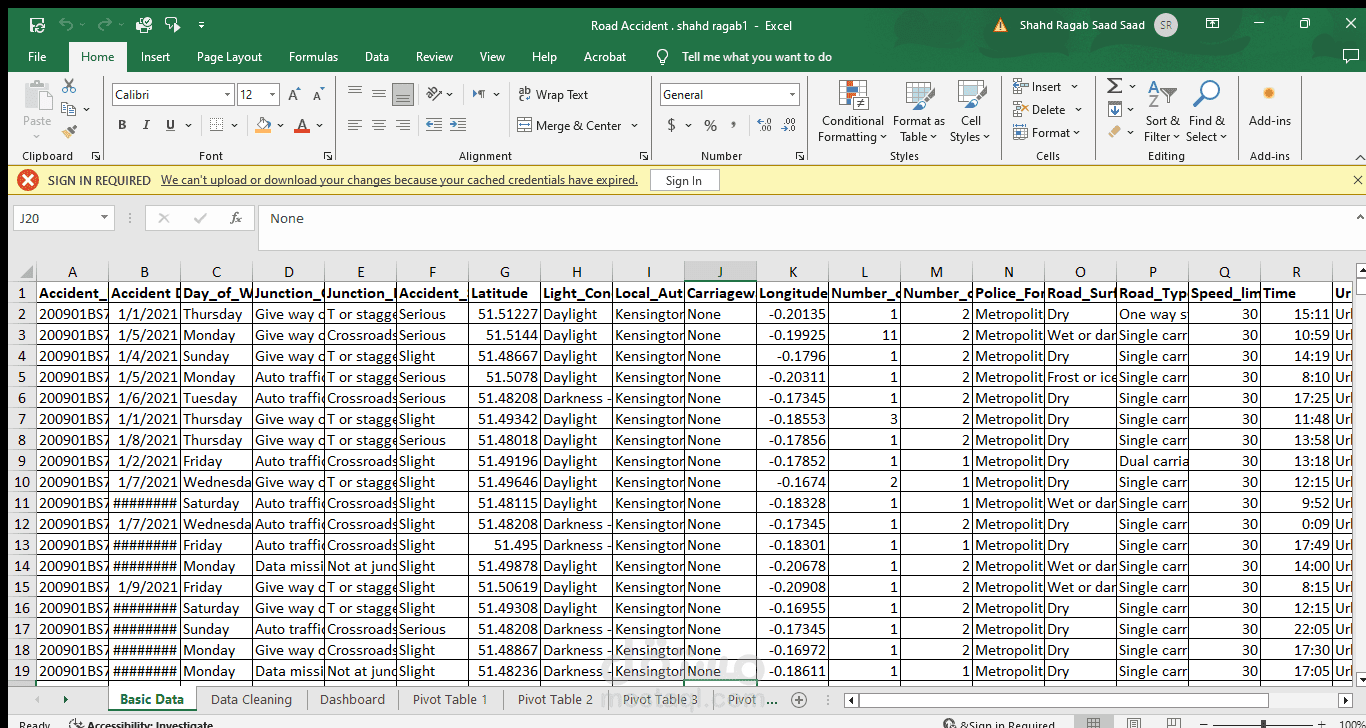
This Road Accident Dashboard is a dynamic analytical tool designed to provide a comprehensive overview of traffic incidents, helping stakeholders identify trends, assess risk factors, and develop safety measures. It features the following components:
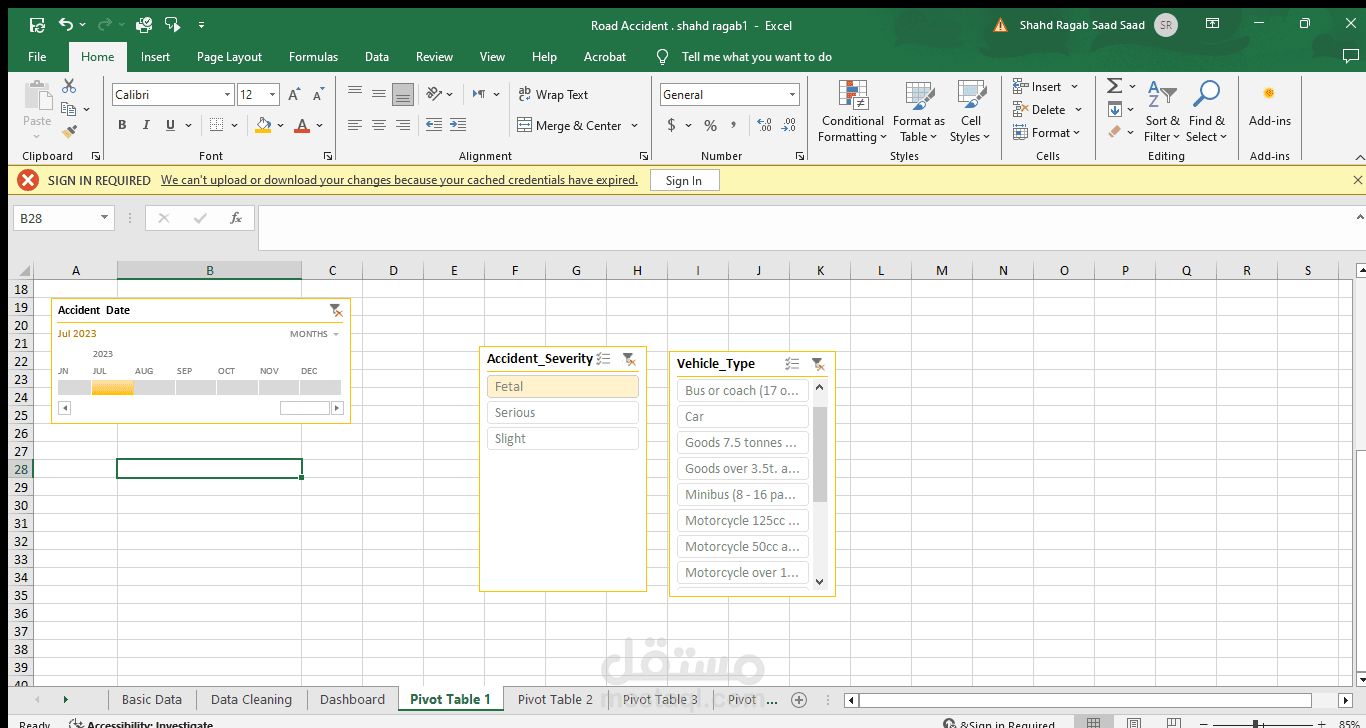
1. Temporal Analysis:
Tracks the total number of casualties over time, highlighting peak accident periods for better resource allocation and preventive measures.
2. Urban vs. Rural Comparison:
Visualizes accident distribution across rural and urban areas, aiding in targeted road safety initiatives.
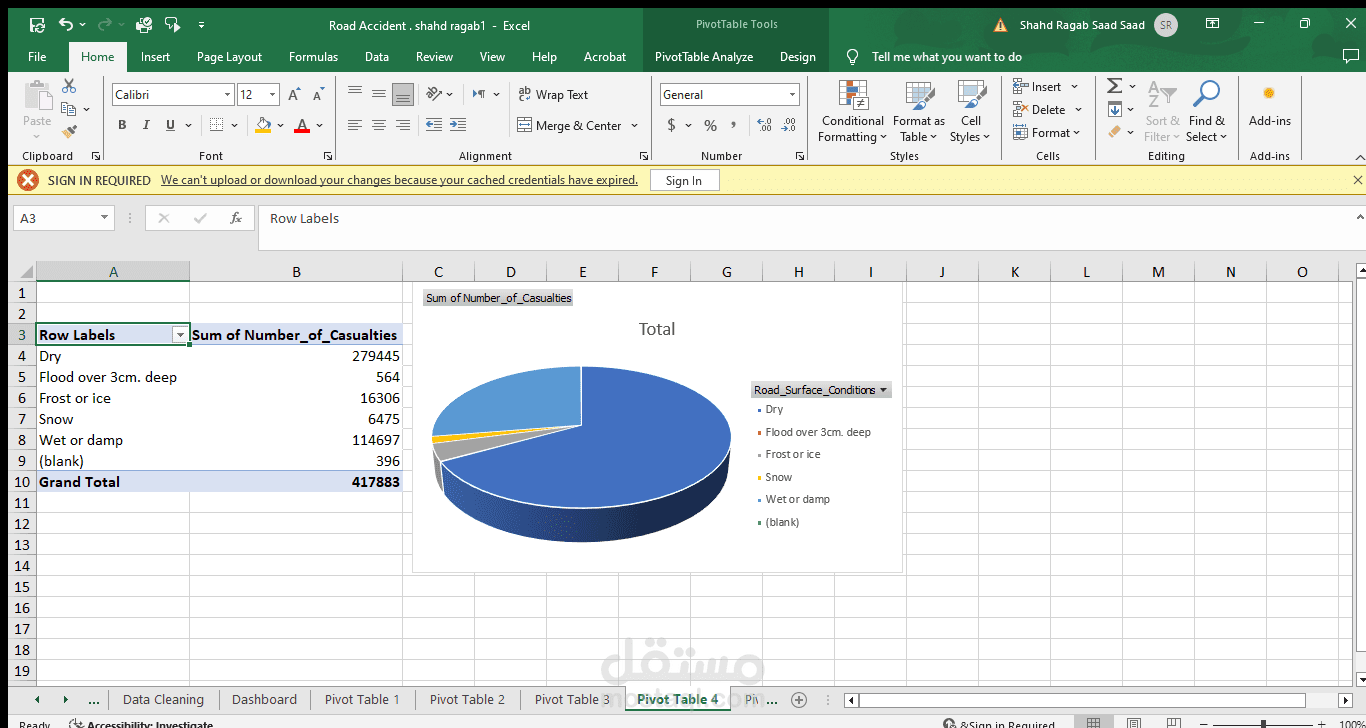
3. Road Surface and Weather Conditions:
Examines the influence of road surface types (e.g., dry, wet, or frosty) and weather conditions on accident frequency to guide infrastructure planning and public warnings.
4. Accident Severity:
Segments incidents by severity (fatal or serious), enabling deeper insights into high-risk factors and locations.
5. Vehicle Type Analysis:
Analyzes the involvement of different vehicle types (cars, motorcycles, trucks, etc.), supporting targeted safety campaigns for high-risk categories.
6. Road Type and Conditions:
Highlights accident distribution by road types, such as single or dual carriageways, emphasizing the need for focused safety measures on vulnerable routes.
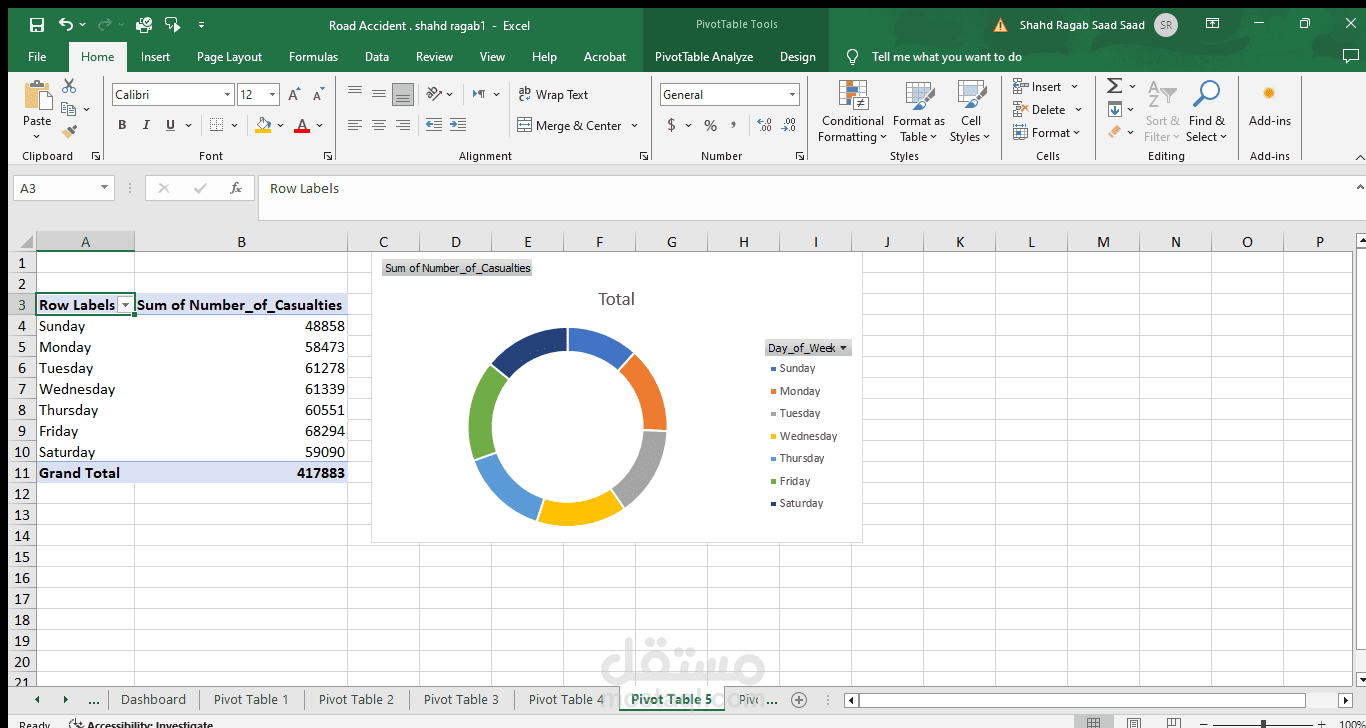
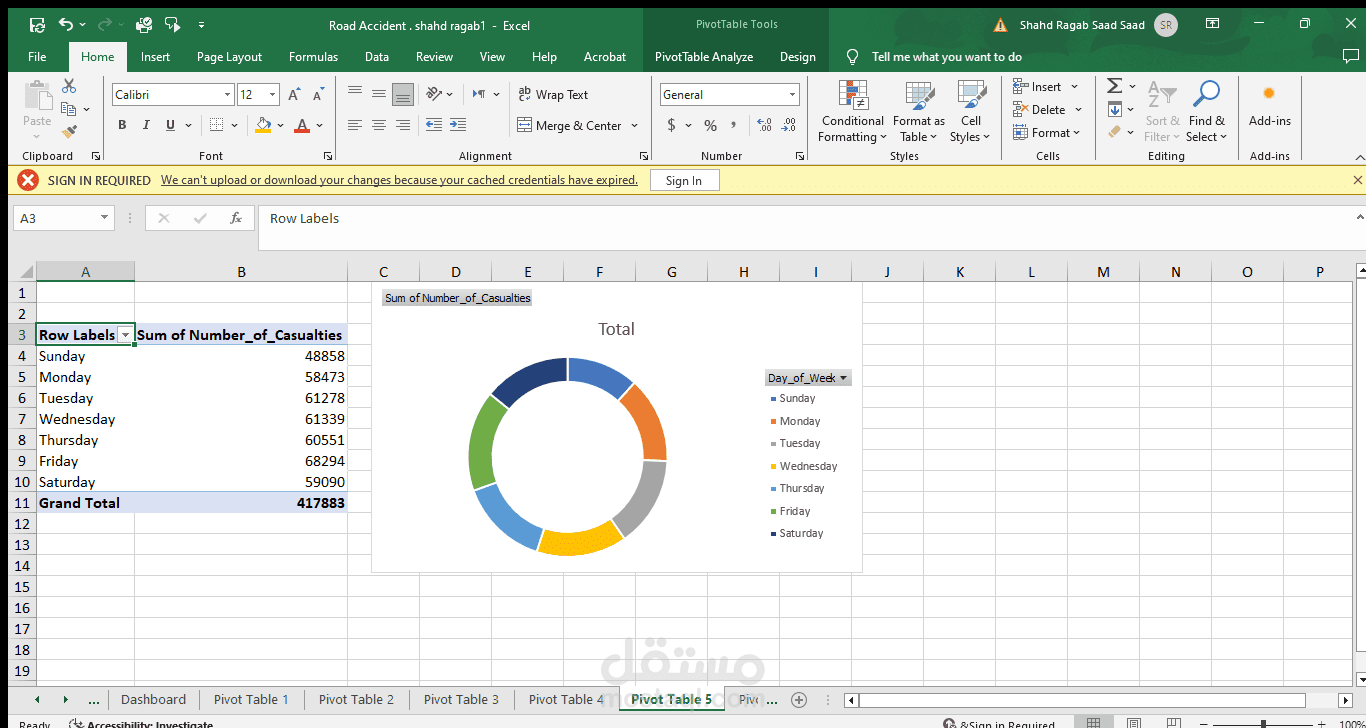
7. Weekly Trends:
Identifies accident patterns across days of the week, providing insights for scheduling law enforcement and awareness campaigns.
This dashboard demonstrates proficiency in using data visualization tools to derive actionable insights from complex datasets, emphasizing expertise in traffic safety analysis, urban planning, and data-driven decision-making. It showcases the ability to build user-centric dashboards for enhancing road safety strategies.