Road accident analysis
تفاصيل العمل
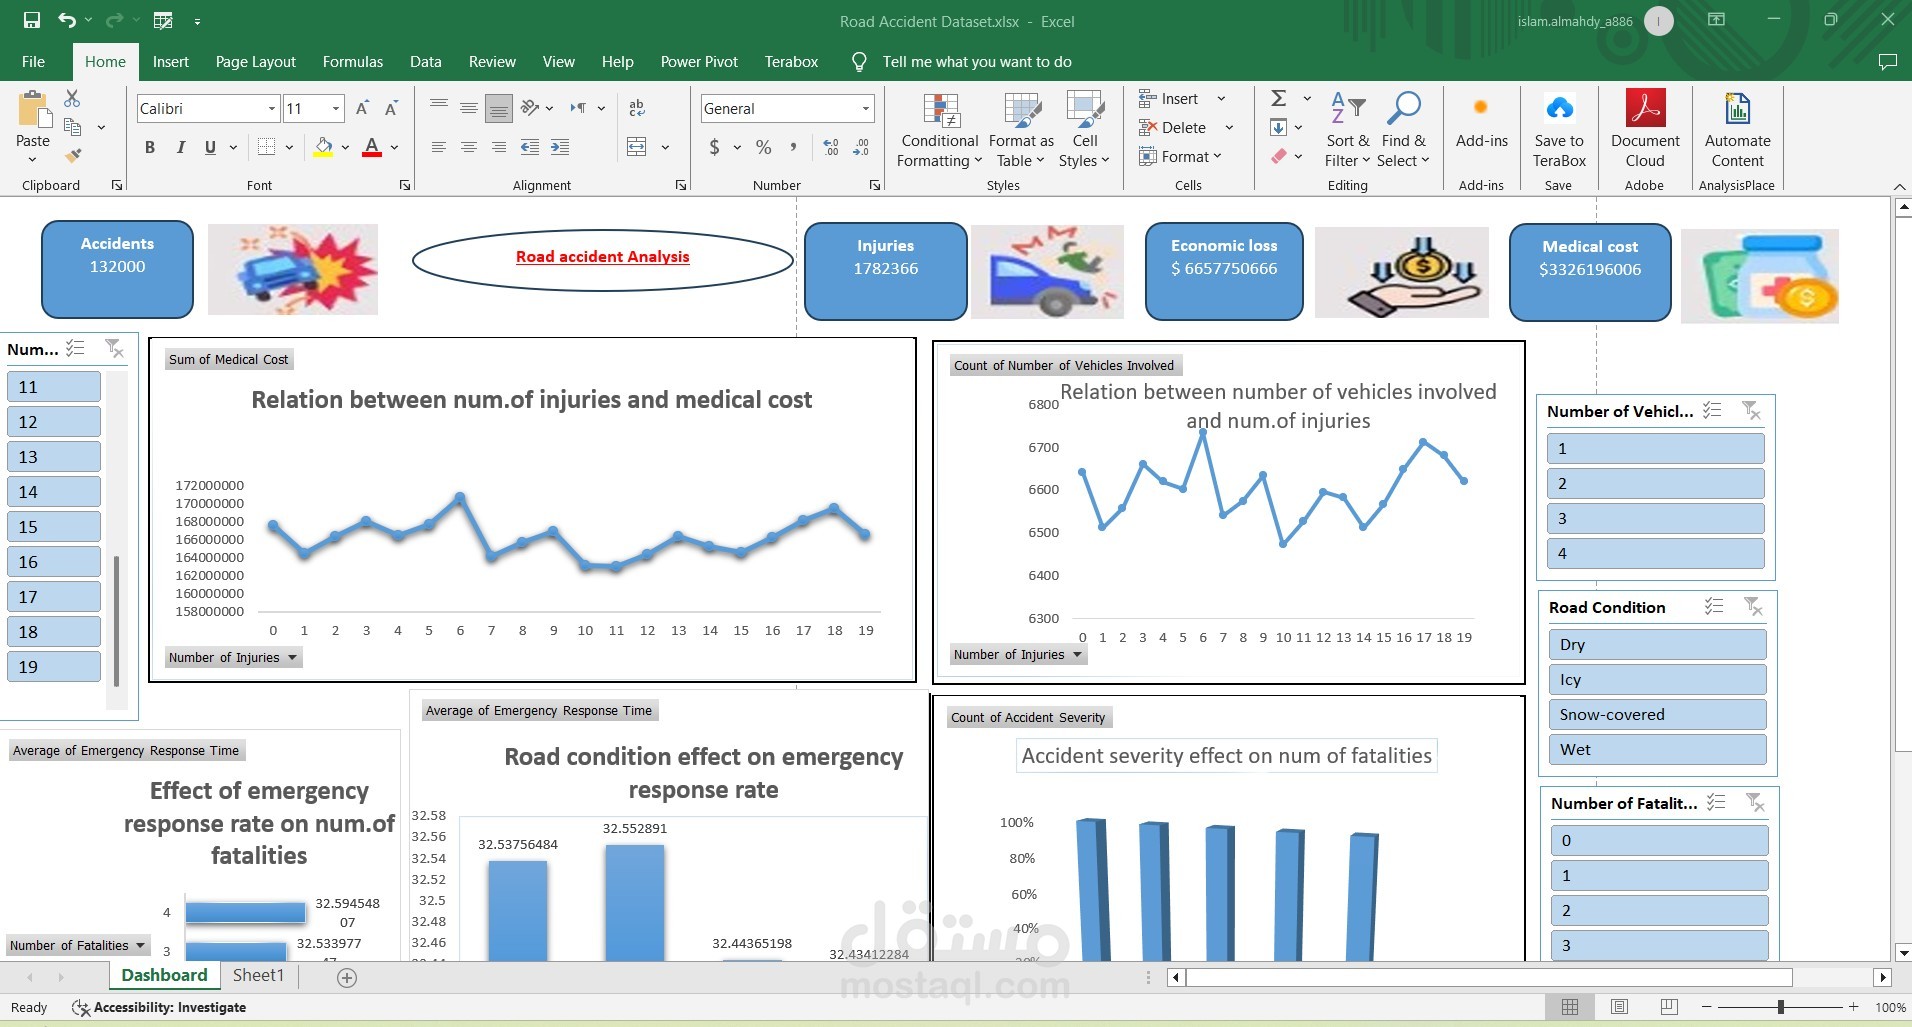
This dashboard is made to analyze Road traffic accidents . The dataset contains 132,000 records of road accidents with 30 columns detailing various factors related to accidents. These columns include:
Time & Location: Country, Year, Month, Day of the Week, Time of Day, Region, Urban/Rural area.
Road & Environmental Factors: Road Type, Weather Conditions, Visibility Level, Speed Limit, Traffic Volume, Road Condition.
Driver & Vehicle Details: Driver Age Group, Driver Gender, Alcohol Level, Fatigue, Vehicle Condition.
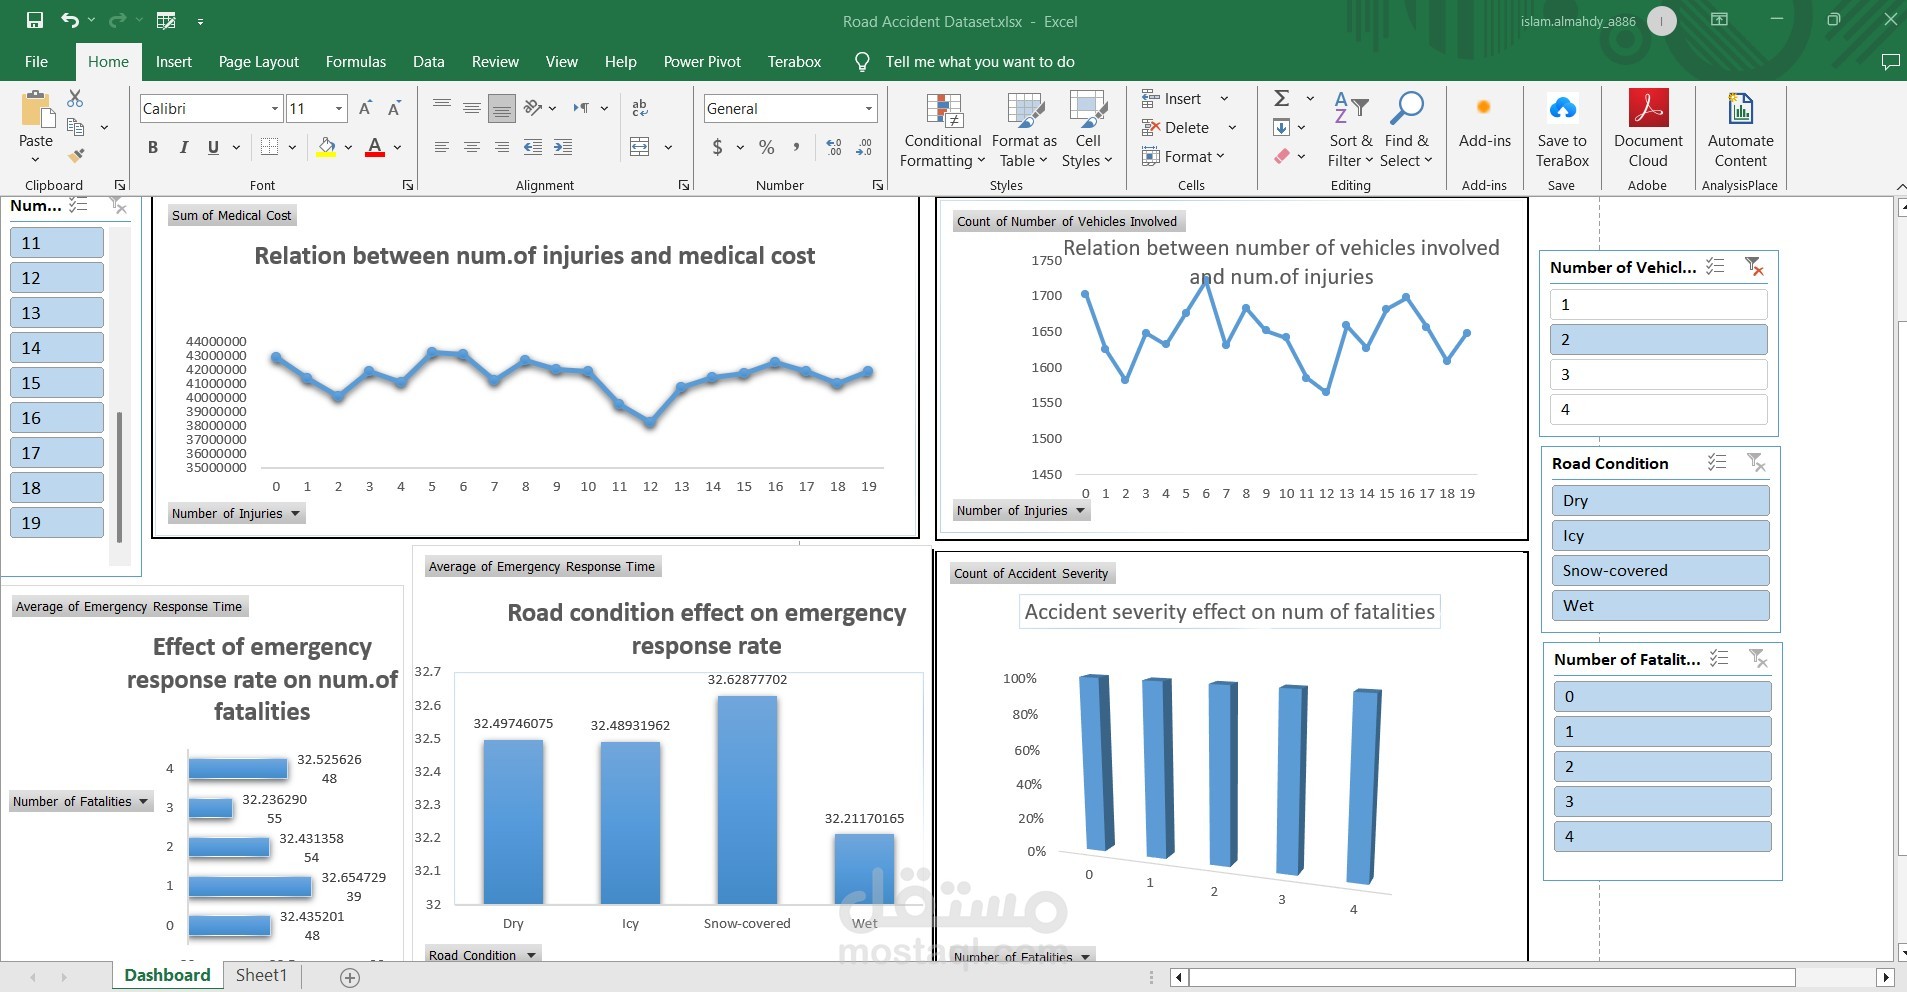
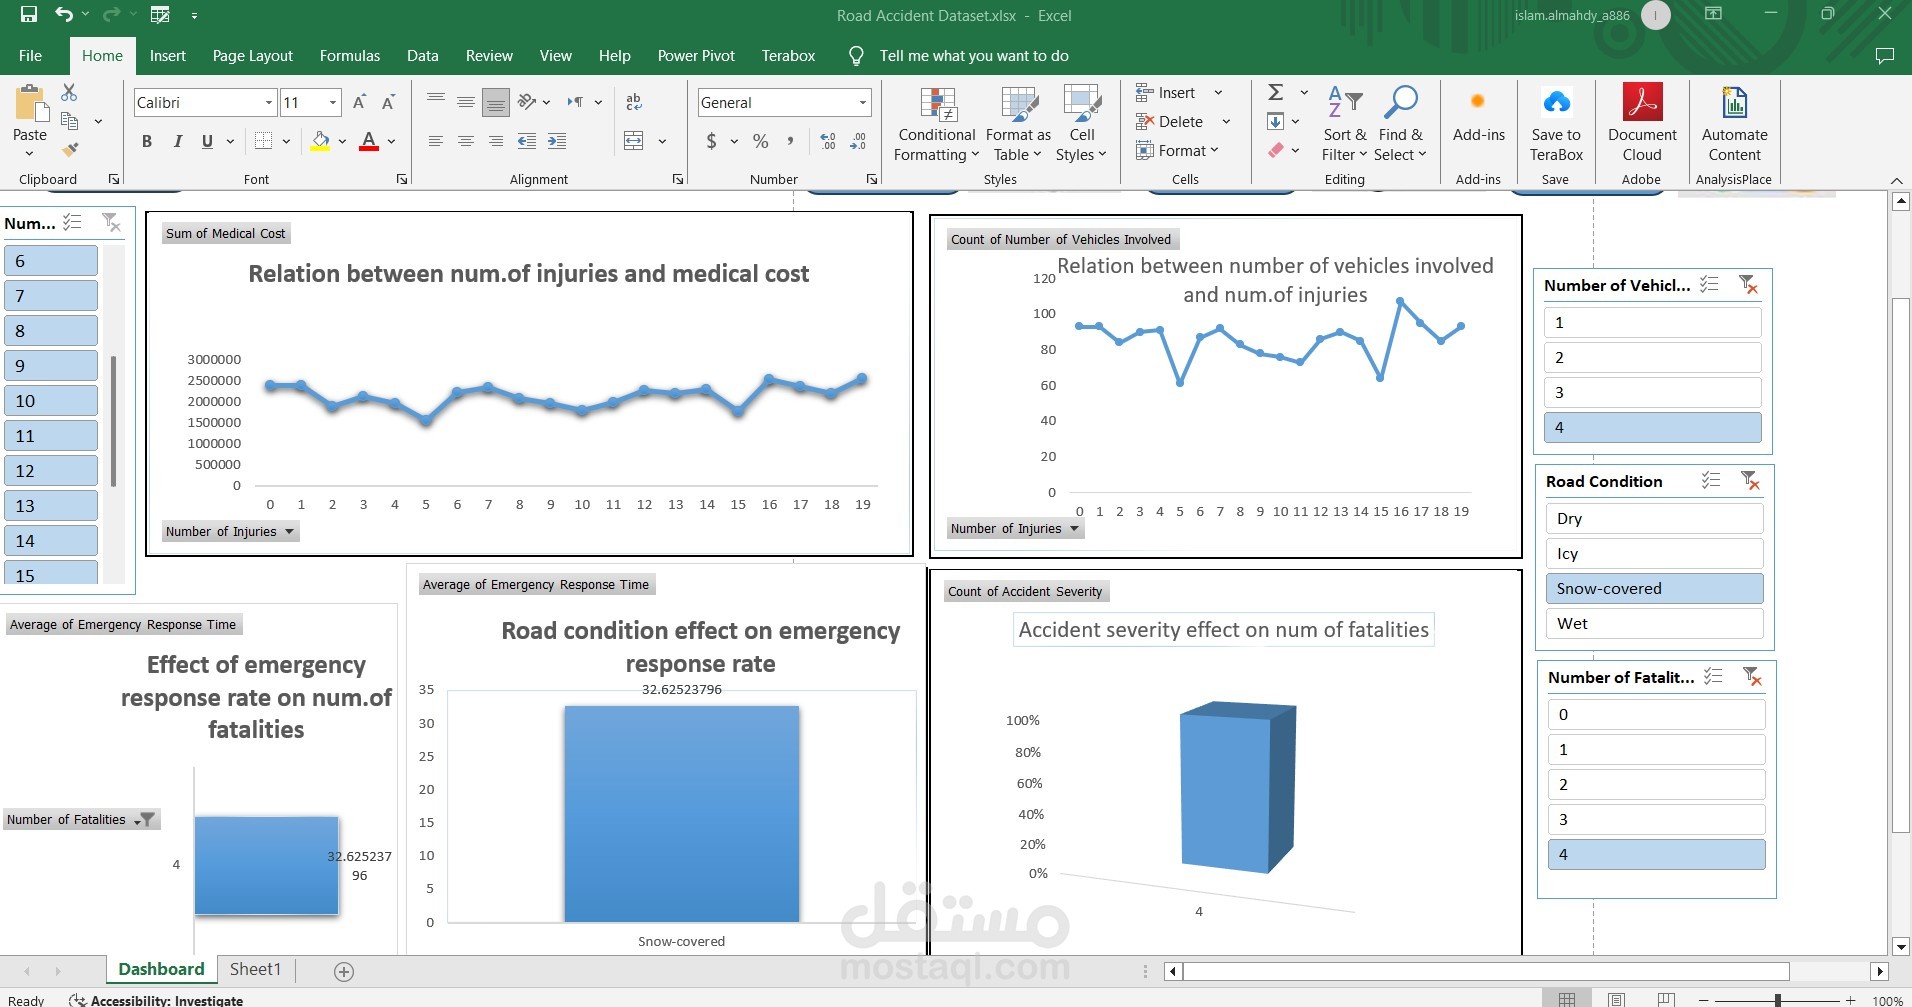
Accident Impact: Number of Vehicles Involved, Pedestrians and Cyclists Involved, Accident Severity, Number of Injuries, Fatalities.
Economic Impact: Insurance Claims, Medical Cost, Economic Loss.
Emergency Response: Emergency Response Time.
Demographics: Population Density.
.This project can be done by both PowerBI and excel (PowerBI can do that effectively, however I preferred to show my skills in using excel which is more difficult for this huge dataset ).