Erythemato squamous diseases dashboard
تفاصيل العمل
* Analyzing Erythemato Squamous Diseases with Power Query and Excel*
As a DEPI graduate, I recently completed a project analyzing data on Erythemato Squamous Diseases from Kaggle. Using Power Query and Excel, I transformed raw data into actionable insights and created an interactive dashboard to visualize our findings. Here’s a snapshot of what we achieved:
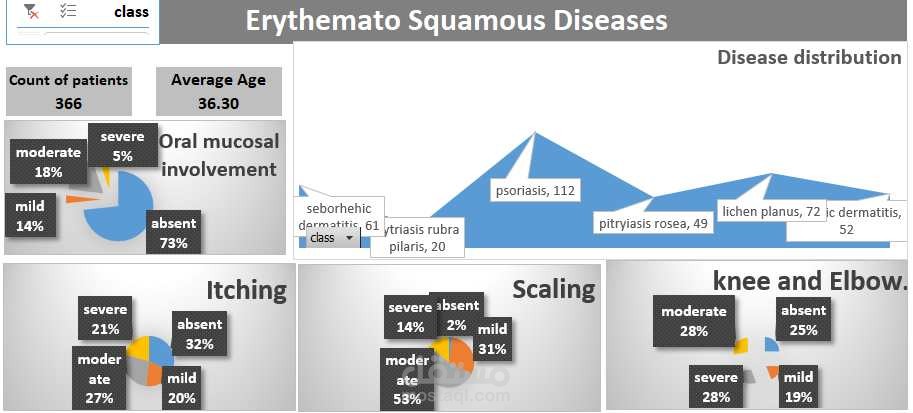
*Key Insights from the Dashboard:*1. *Patient Count and Average Age*:
- Total number of patients: 366
- Average age: 36.30 years
2. *Oral Mucosal Involvement*:
- Absent: 73%
- Mild: 14%
- Moderate: 18%
- Severe: 5%
3. *Disease Distribution*:
- Psoriasis: 112 cases
- Seborrheic Dermatitis: 61 cases
- Lichen Planus: 72 cases
- Pityriasis Rosea: 49 cases
- Chronic Dermatitis: 52 cases
- Pityriasis Rubra Pilaris: 20 cases
4. *Itching Severity*:
- Absent: 32%
- Mild: 20%
- Moderate: 27%
- Severe: 21%
5. *Scaling Severity*:
- Absent: 53%
- Mild: 31%
- Moderate: 14%
- Severe: 2%
6. *Knee and Elbow Involvement*:
- Absent: 25%
- Mild: 19%
- Moderate: 28%
- Severe: 28%
*Tools & Techniques:*- *Power Query*: Streamlined data cleaning and preprocessing.
- *Excel*: Leveraged to create an interactive dashboard, making data easily accessible and actionable.
*Impact:*- *Data-Driven Decisions*: Enhanced understanding of disease prevalence and severity, aiding in better medical decisions and resource allocation.
- *Improved Visualization*: Clear and concise visual representation of complex data, making it easier to communicate findings to stakeholders.