Bikes sales
تفاصيل العمل
Bikes sales
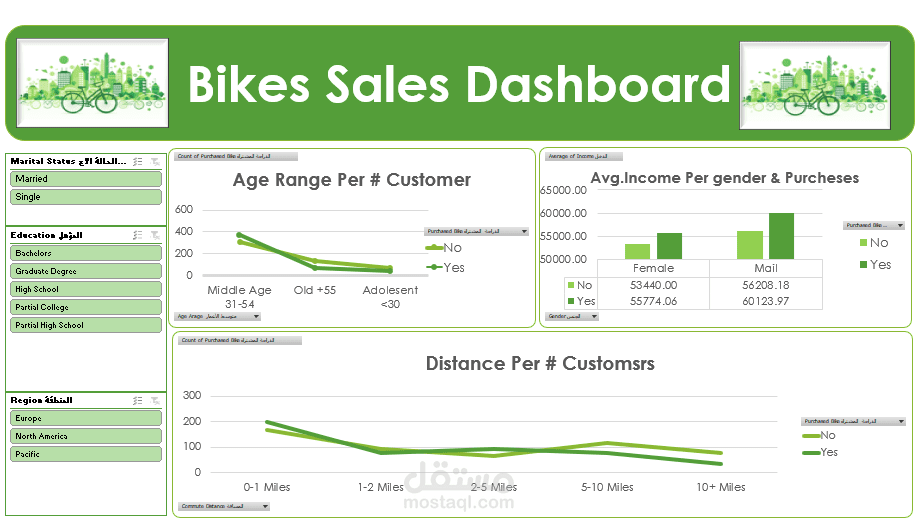
I completed this data-driven project, utilizing Excel and SQL to analyze bike sales data. The insights were then
visualized in an interactive dashboard, highlighting key trends and metrics.
Key Highlights:
• Bikes per Distance & Status: Analyze customer preferences by distance traveled and purchase status.
• Customer Age Groups: Visualize the distribution of bike purchases across different age groups.
• Salary Analysis: Compare income levels by gender and region for deeper demographic insights.
This project taught me how to:
Use Excel for data cleaning and calculations.
Design dashboards that effectively communicate insights