Supermarket Sales Dashboard
تفاصيل العمل
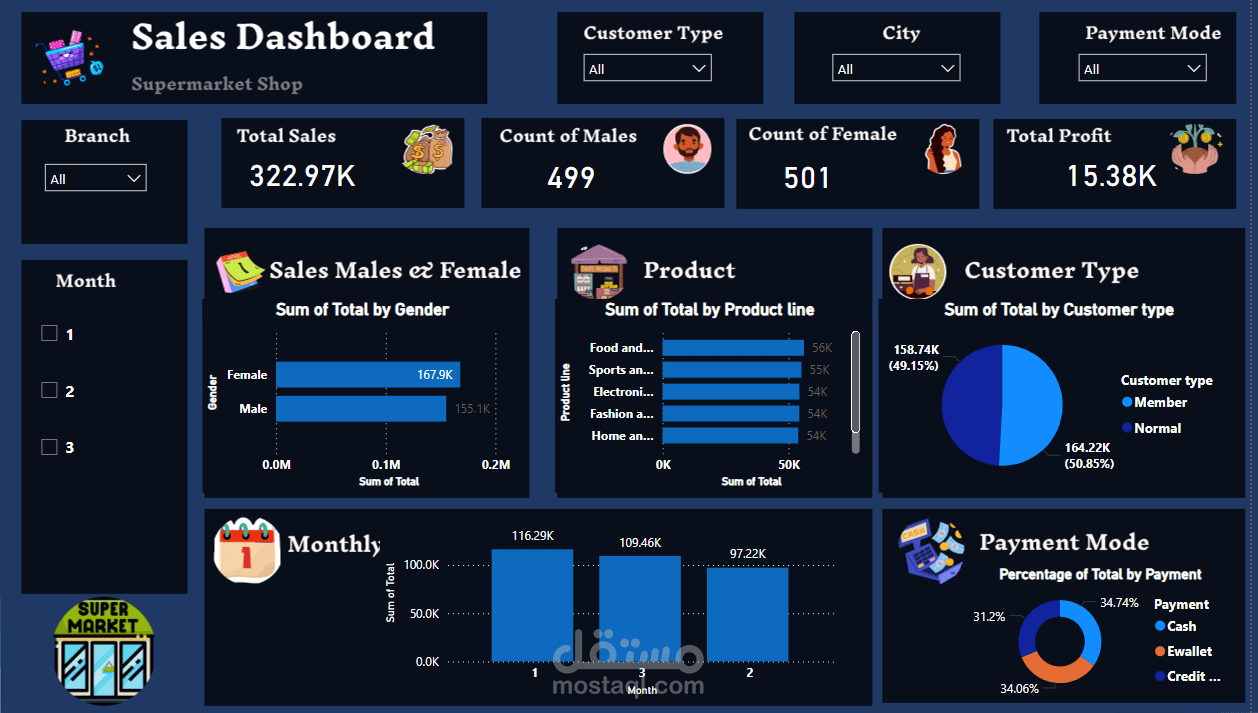

Tools and Techniques Used:
Power BI for building the dashboard and visualizing the data.
️ Power Query for cleaning and transforming data.
? DAX for advanced calculations and metric analysis.
Key Insights from the Analysis:
Top-performing branches: Identified the branches with the highest sales and best overall performance.
Customer behavior: Analyzed buying patterns for men and women in each city to understand the dominant category and their preferences.
Top products: Determined the most purchased products for each gender, enabling smarter promotional strategies.
Payment methods: Uncovered the most commonly used payment methods (cash, cards, or digital wallets) for each branch and city.
Profitability: Calculated total profits per product and branch to pinpoint areas for growth.
Monthly sales trends: Tracked monthly sales across cities and branches to identify peak seasons and trends.
The Value Delivered by the Dashboard: