HR Dashboard Project
تفاصيل العمل
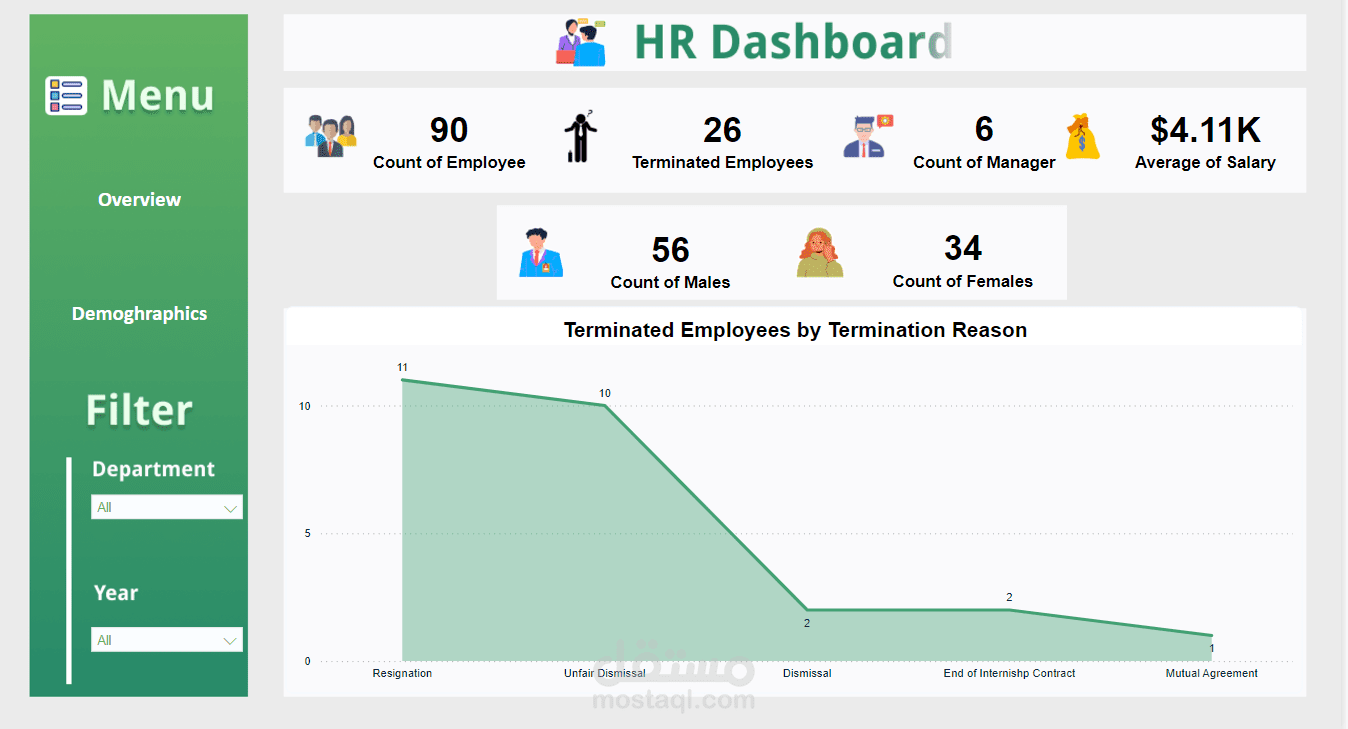

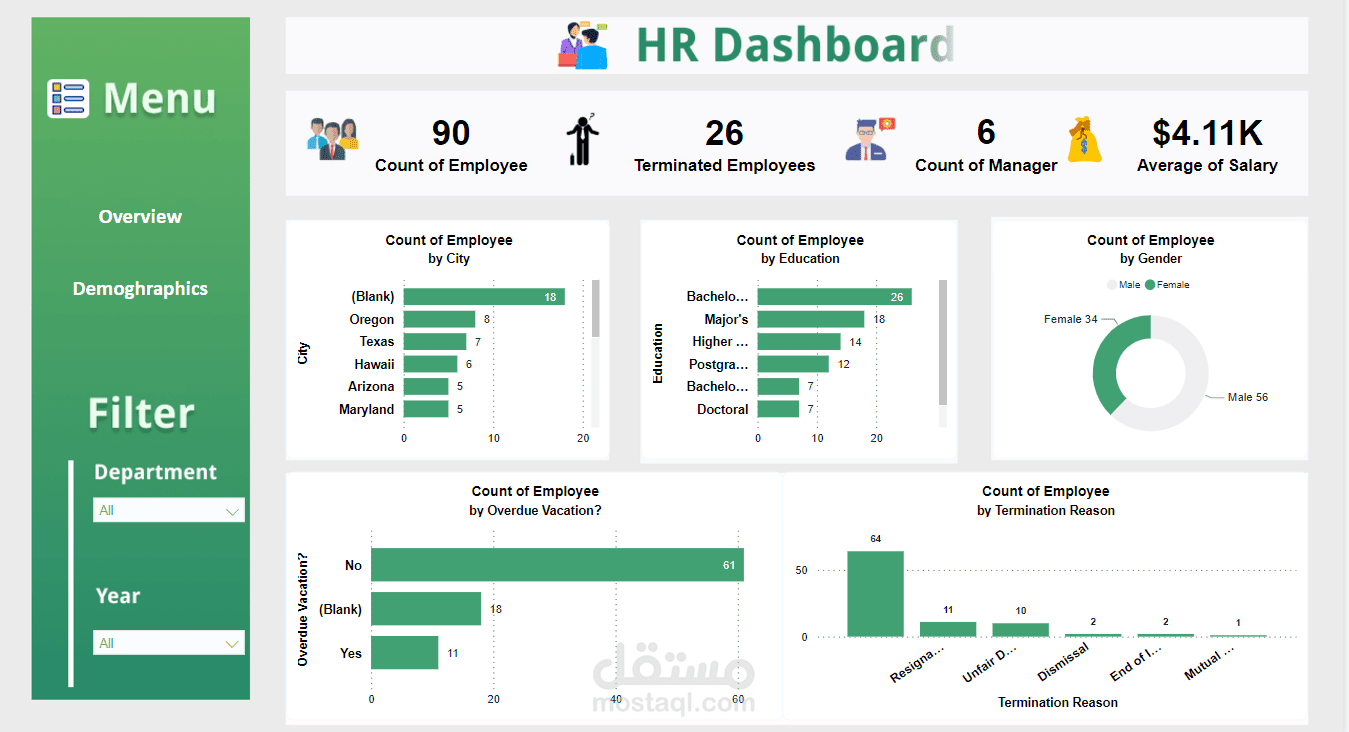
This dashboard was designed to help HR teams monitor key metrics, such as:
Employee Demographics (gender, city, education levels)
Termination Trends (reasons and frequencies)
Overdue Vacation Analysis
Average Salaries and Management Counts
Key Features:
Interactive Filters: The dashboard allows users to filter data by department and year for more focused analysis.
Visualization-Driven Insights: From bar charts to pie charts, the visualizations make it easy to identify trends like resignation rates and overdue vacations.
Employee Termination Analysis: Understand the primary causes of employee turnover to guide retention strategies.
This project helped me enhance my skills in Power BI, data visualization, and data storytelling. I aimed to turn raw data into a tool that empowers HR professionals to make informed decisions effectively.