Pharmacy Retail Sales Analysis
تفاصيل العمل

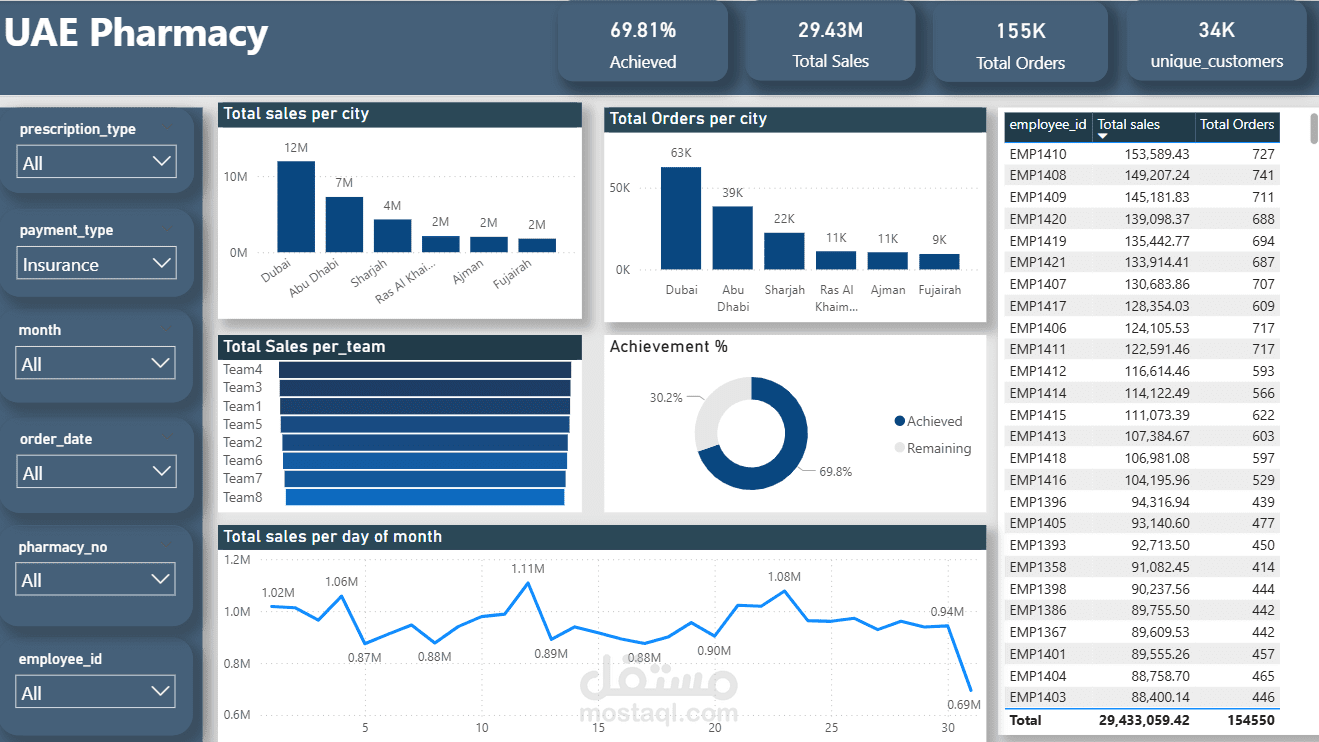
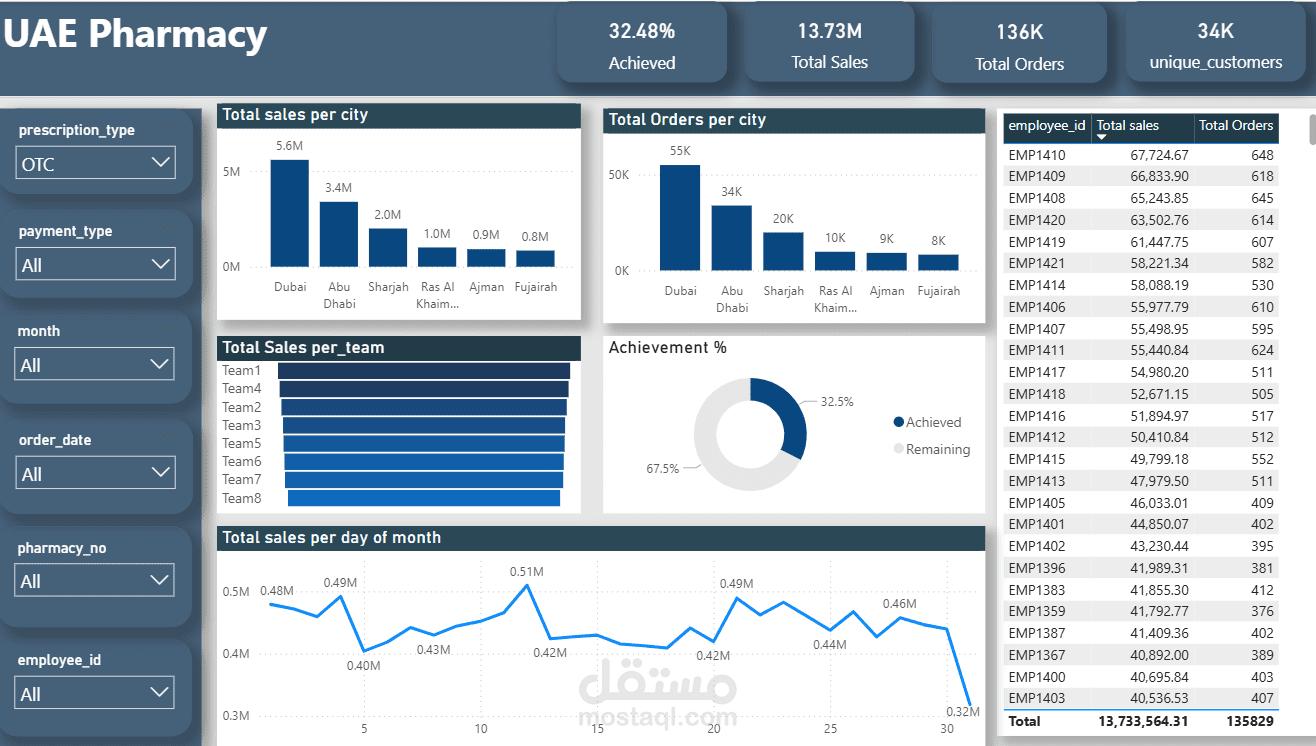
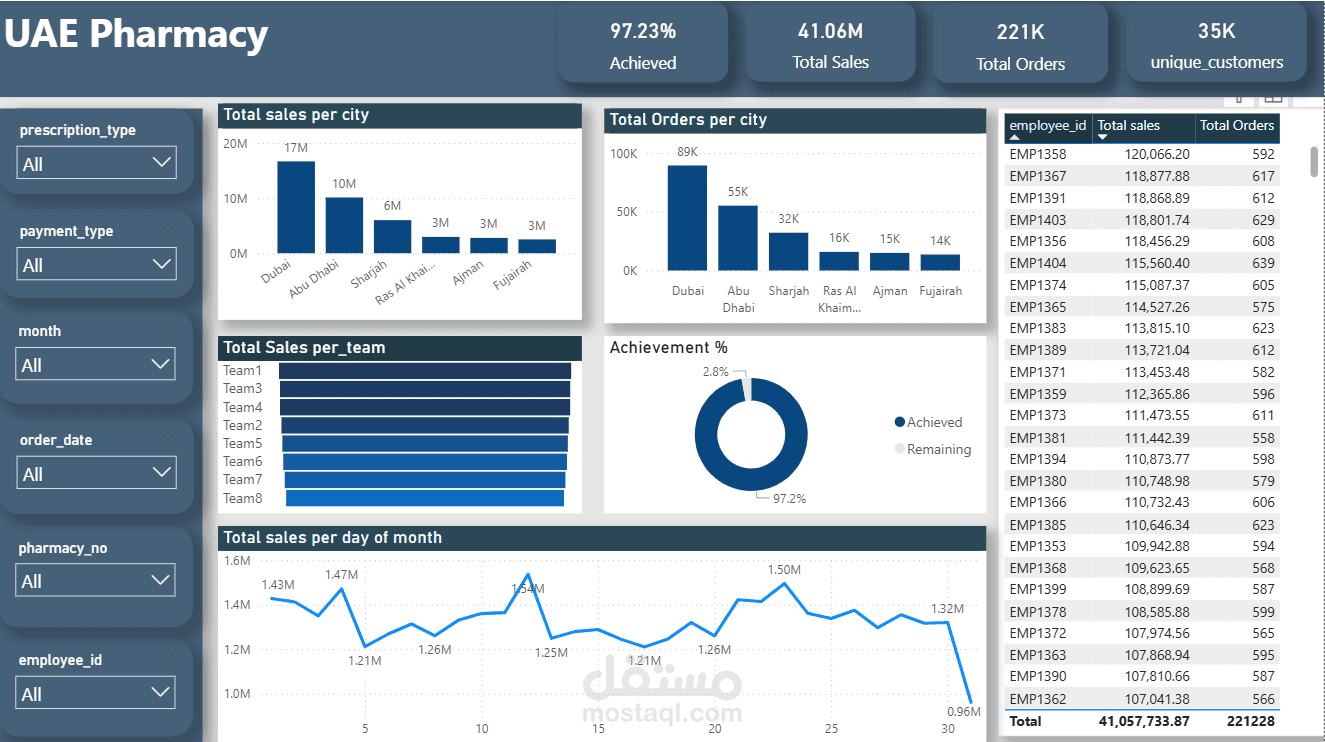
Cleaned, transformed and modelled pharmacy sales data with SQL, including branch performance, product turnover, customer segmentation, and frequency/monetary behavior
Created Power BI dashboards and DAX measures to deliver interactive KPIs such as Total Sales, Sales by Branch, Sales by Product, Customer Lifetime Value, Order Frequency, and Churn Risk
Designed visualizations that highlighted: Branch-to-branch performance variations, Concentration of revenue among, loyal customers, Seasonal trends and outlier orders, Underperforming product lines and customer segments for retention focus