Product Performance Dashboard
تفاصيل العمل
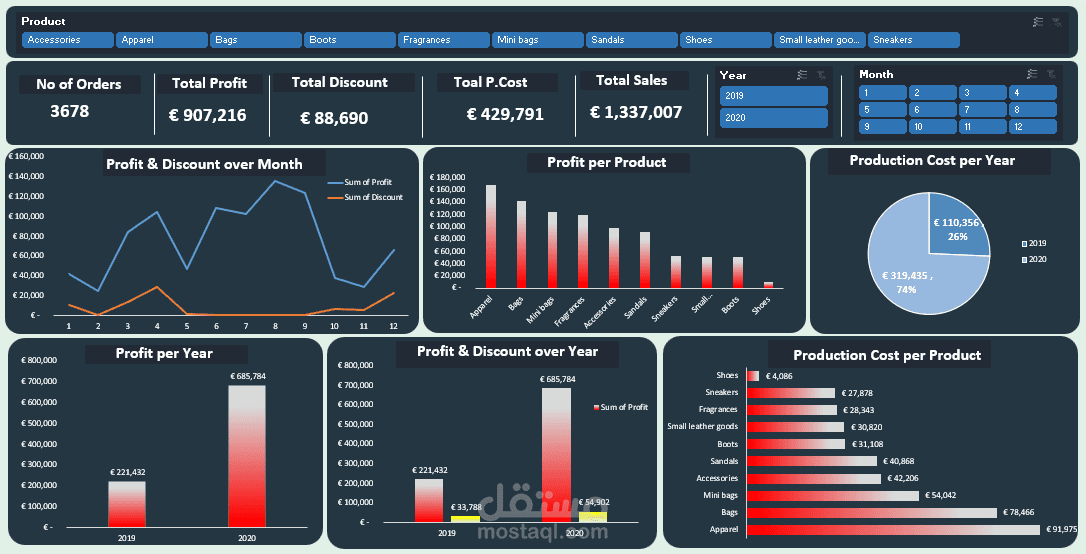
This is a product performance dashboard that visually analyzes sales, profit, discounts, and production costs across different product categories. Below is an overview of the key insights:
Summary Metrics
No of Orders: 3,678
Total Profit: €907,216
Total Discount: €88,690
Total Production Cost: €429,791
Total Sales: €1,337,007
Key Visualizations
Profit & Discount Over Months:
A line graph showing the fluctuation of profit and discount values over the months (1 to 12). Profit peaks around the mid-year, while discounts remain relatively stable.
Profit Per Product:
A bar chart showing profit distribution among different products, with "Apparel" leading and "Shoes" contributing the least.
Production Cost Per Year:
A pie chart illustrating production costs by year:
2019: €110,356 (26%)
2020: €319,435 (74%)
Profit Per Year:
A comparison of yearly profit:
2019: €221,432
2020: €685,784 (significant increase).
Profit & Discount Over Year:
A side-by-side bar chart comparing profit and discount by year:
2019: Profit (€221,432) vs Discount (€33,788)
2020: Profit (€685,784) vs Discount (€54,902)
Production Cost Per Product:
A horizontal bar chart showing production costs for each product category, with "Apparel" having the highest cost and "Shoes" the lowest.
Insights:
Profitability increased significantly in 2020 compared to 2019.
Apparel is the top-performing product in both profit and production cost.
Discounts are relatively minor compared to total profits, indicating efficient sales strategies.
Shoes have the lowest production costs but also generate minimal profit.
This dashboard is ideal for understanding sales trends, product performance, and cost efficiency, helping in strategic decision-making for inventory management and pricing.