Food's Sales Dashboard
تفاصيل العمل
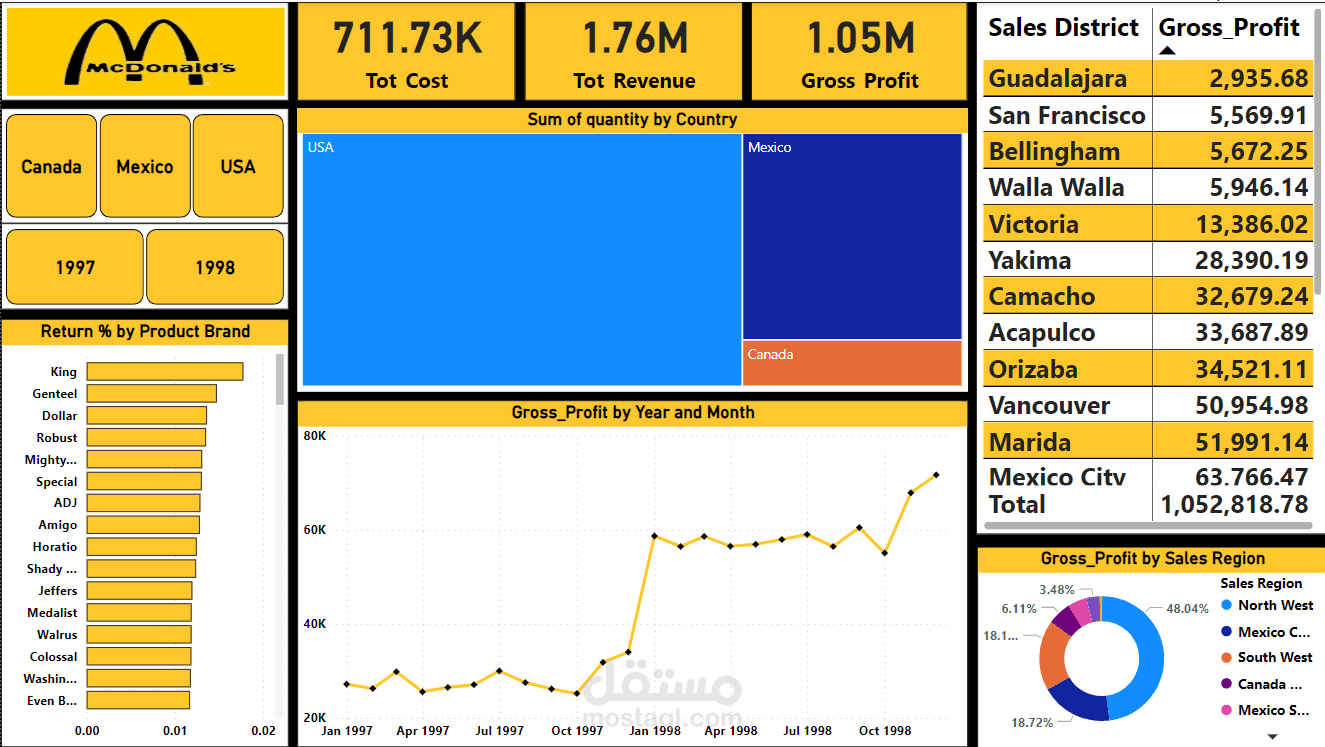
1️⃣ Page 1: Key performance indicators (KPIs) such as total cost, revenue, and gross profit, alongside regional and product-level breakdowns. Visuals reveal trends in sales and profitability across districts and regions.
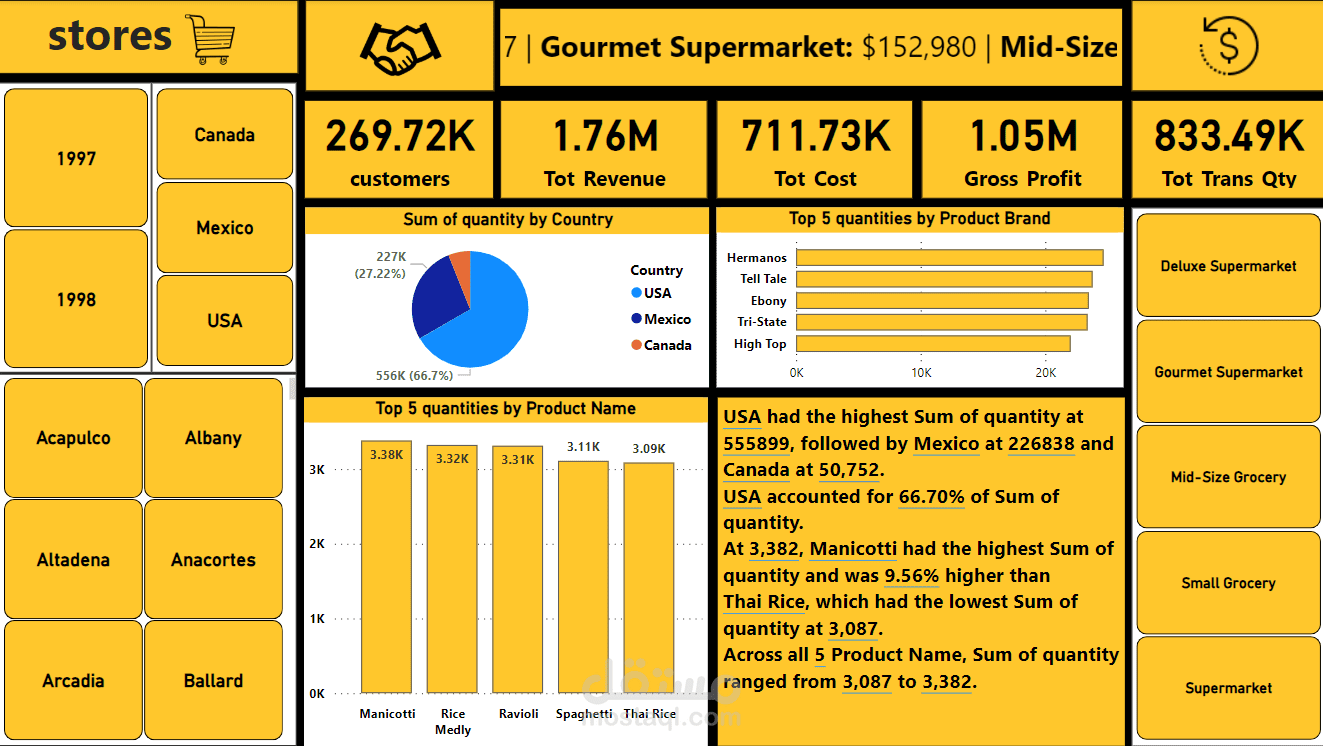
2️⃣ Page 2: A deeper dive into store-level performance, customer demographics, and product-level sales data. This page highlights top-performing stores and products while identifying areas for growth.
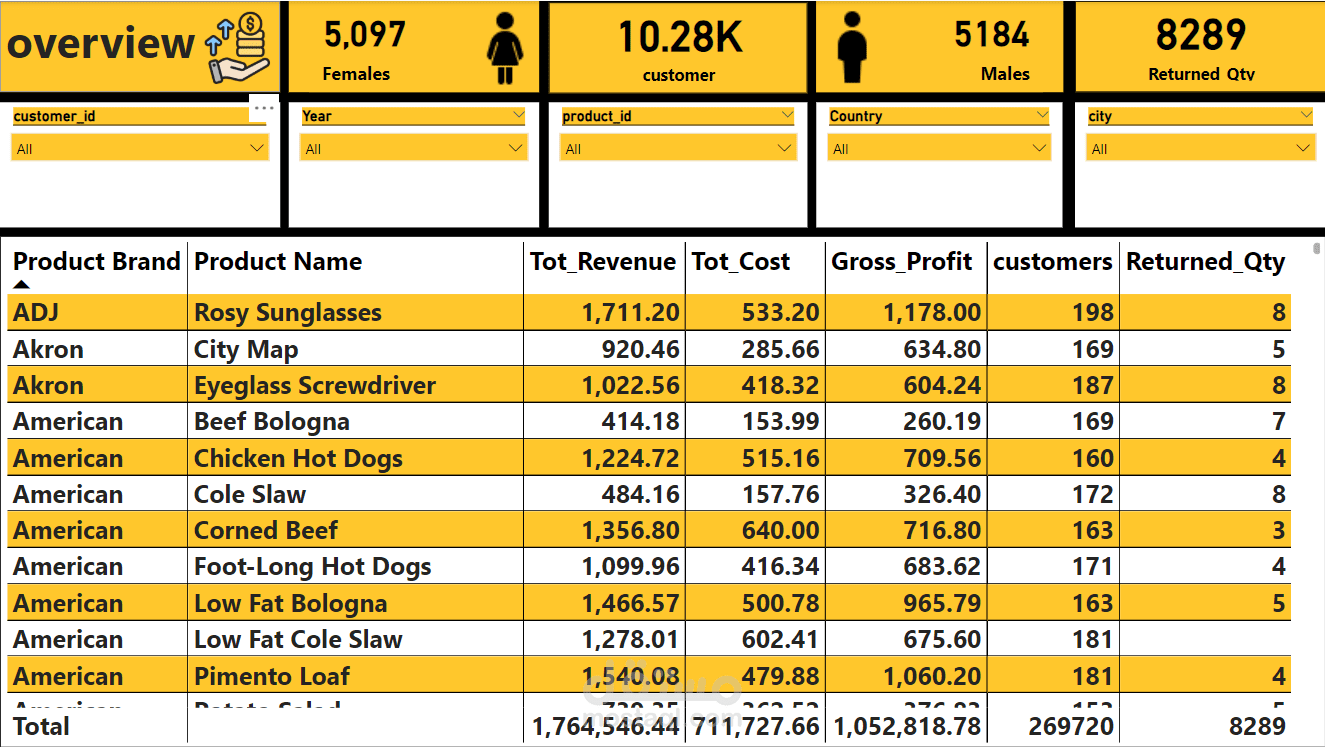
3️⃣ Page 3: A comprehensive summary with gender-based customer insights, product returns, and brand-level profitability metrics.
Key Takeaways:
USA leads in total sales quantity, contributing over 66% of the share.
Products like "Manicotti" and "Rice Medley" dominate quantities sold.
Gross profit trends exhibit significant growth over 1997–1998.
Tools Used: [Power BI/ Tableau/ Excel, if applicable]
This project not only sharpened my data visualization skills but also honed my ability to derive actionable business insights from data.
Would love to hear your thoughts! How can this type of dashboard bring value to businesses in other industries?