Sales analysis
تفاصيل العمل
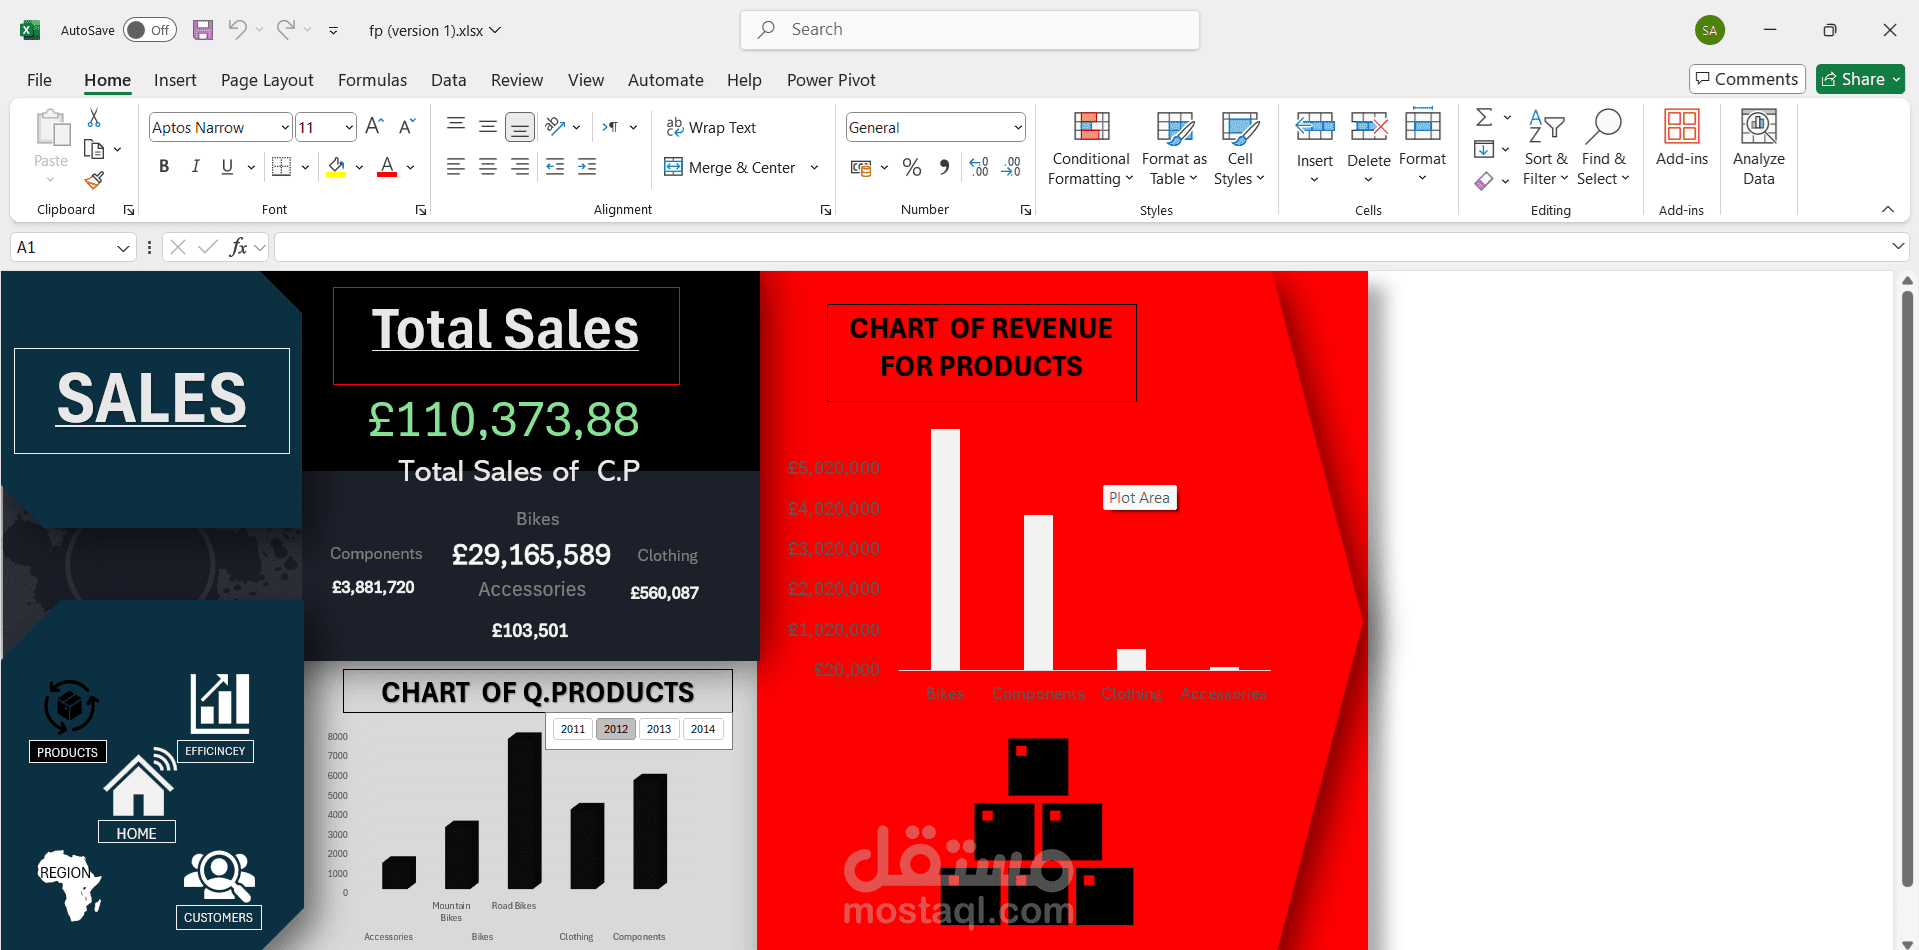
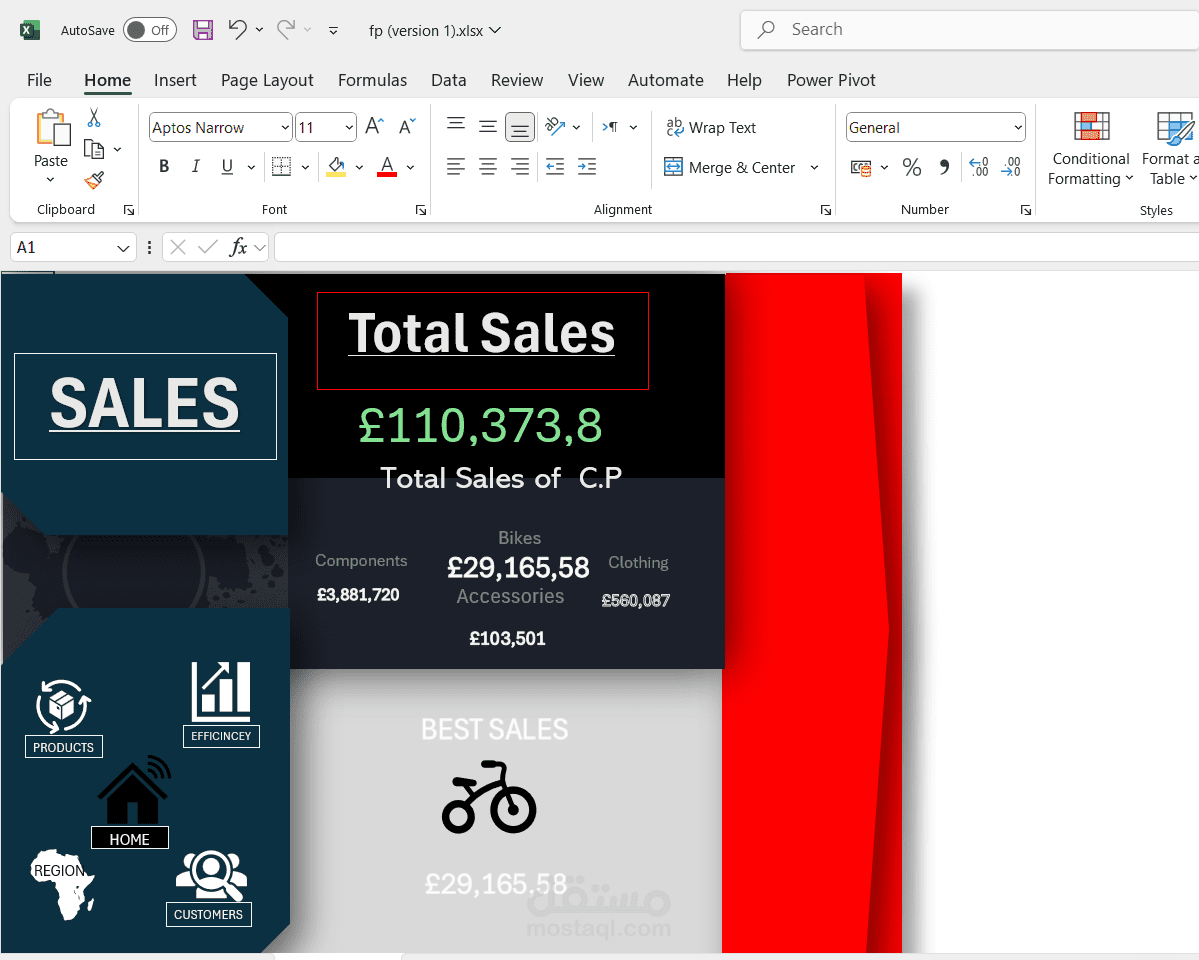
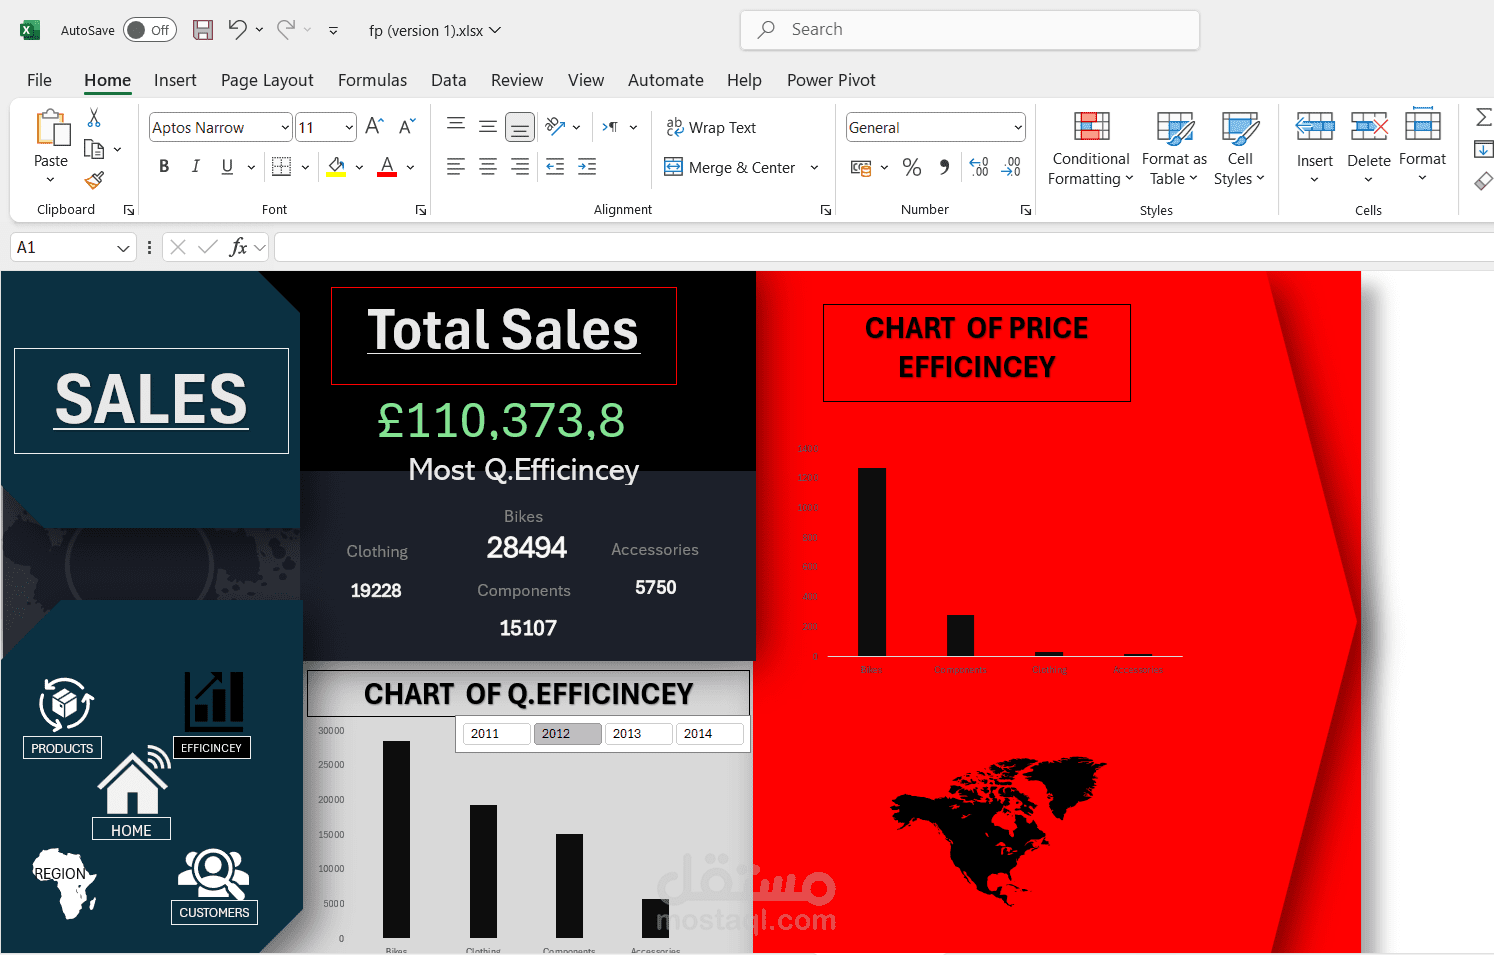
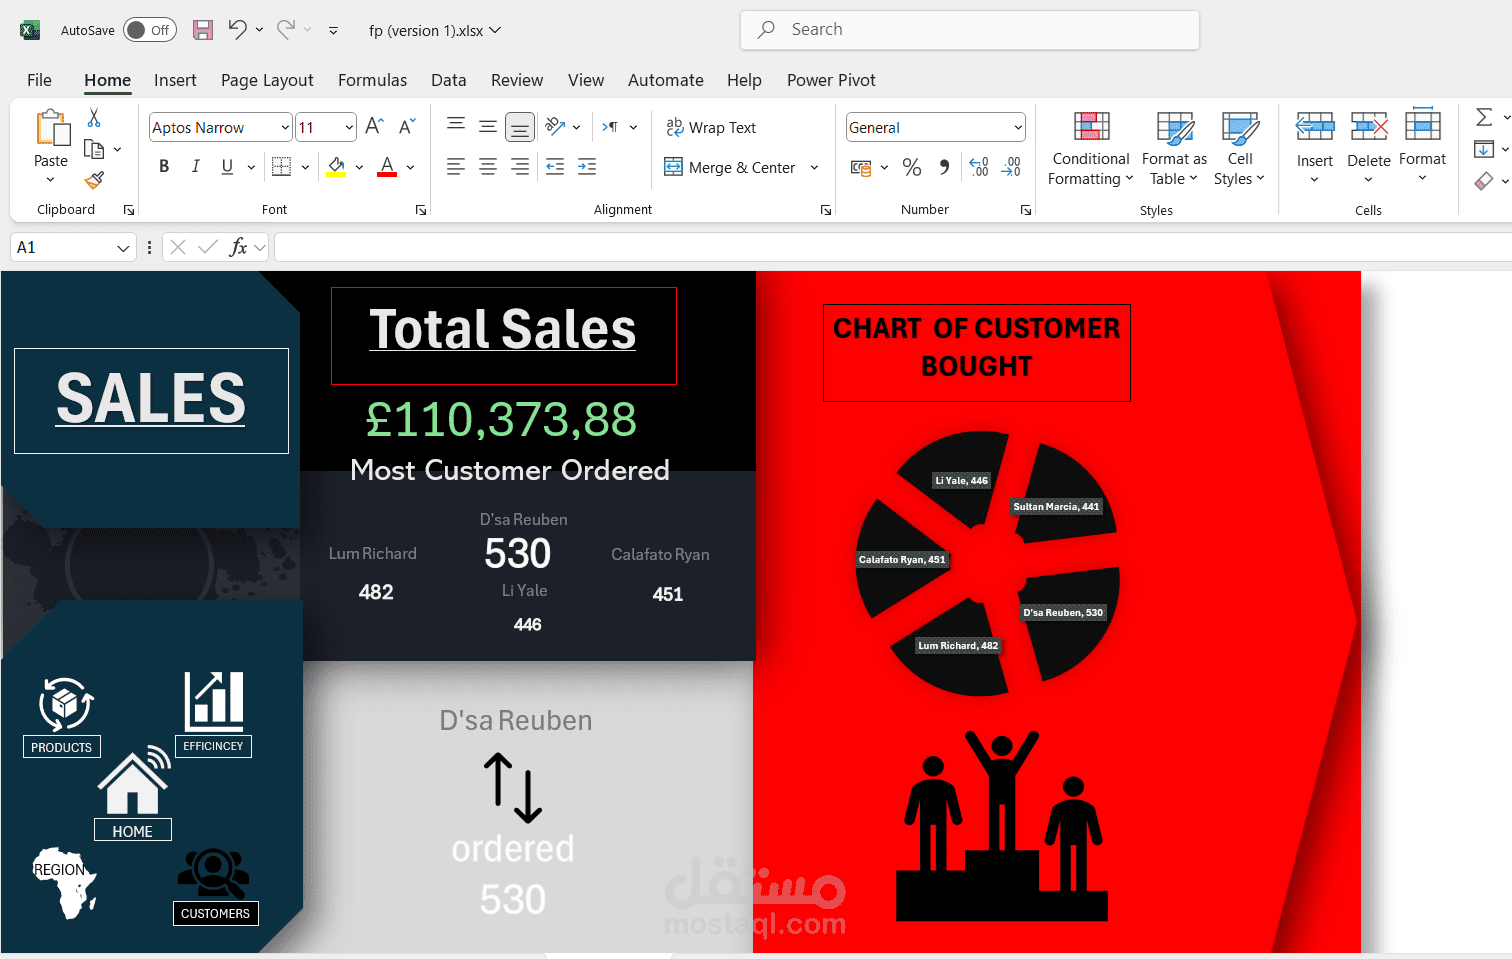
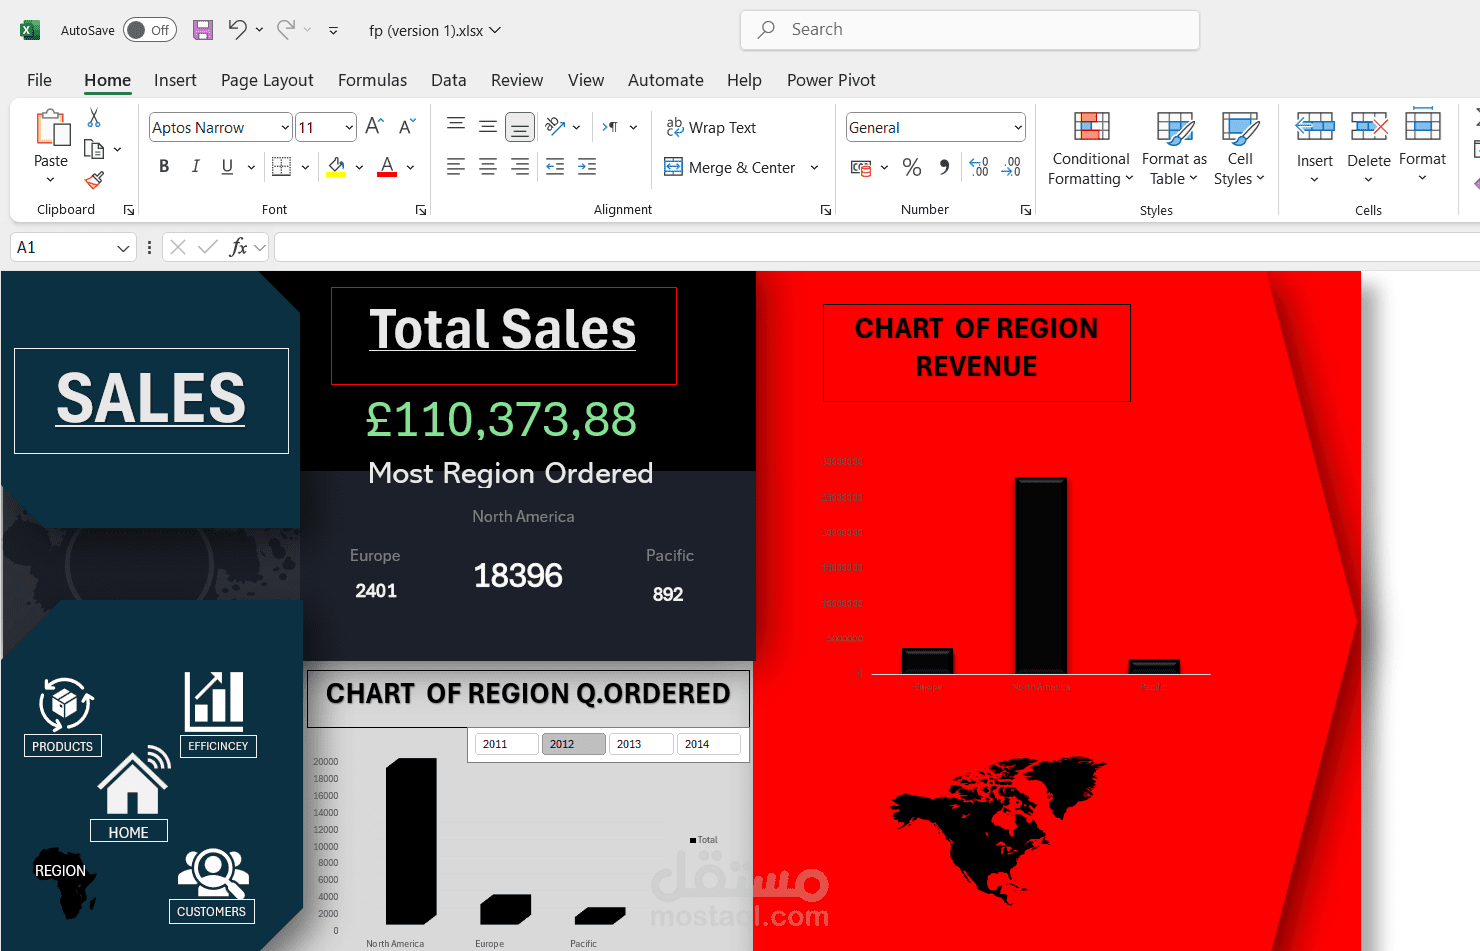
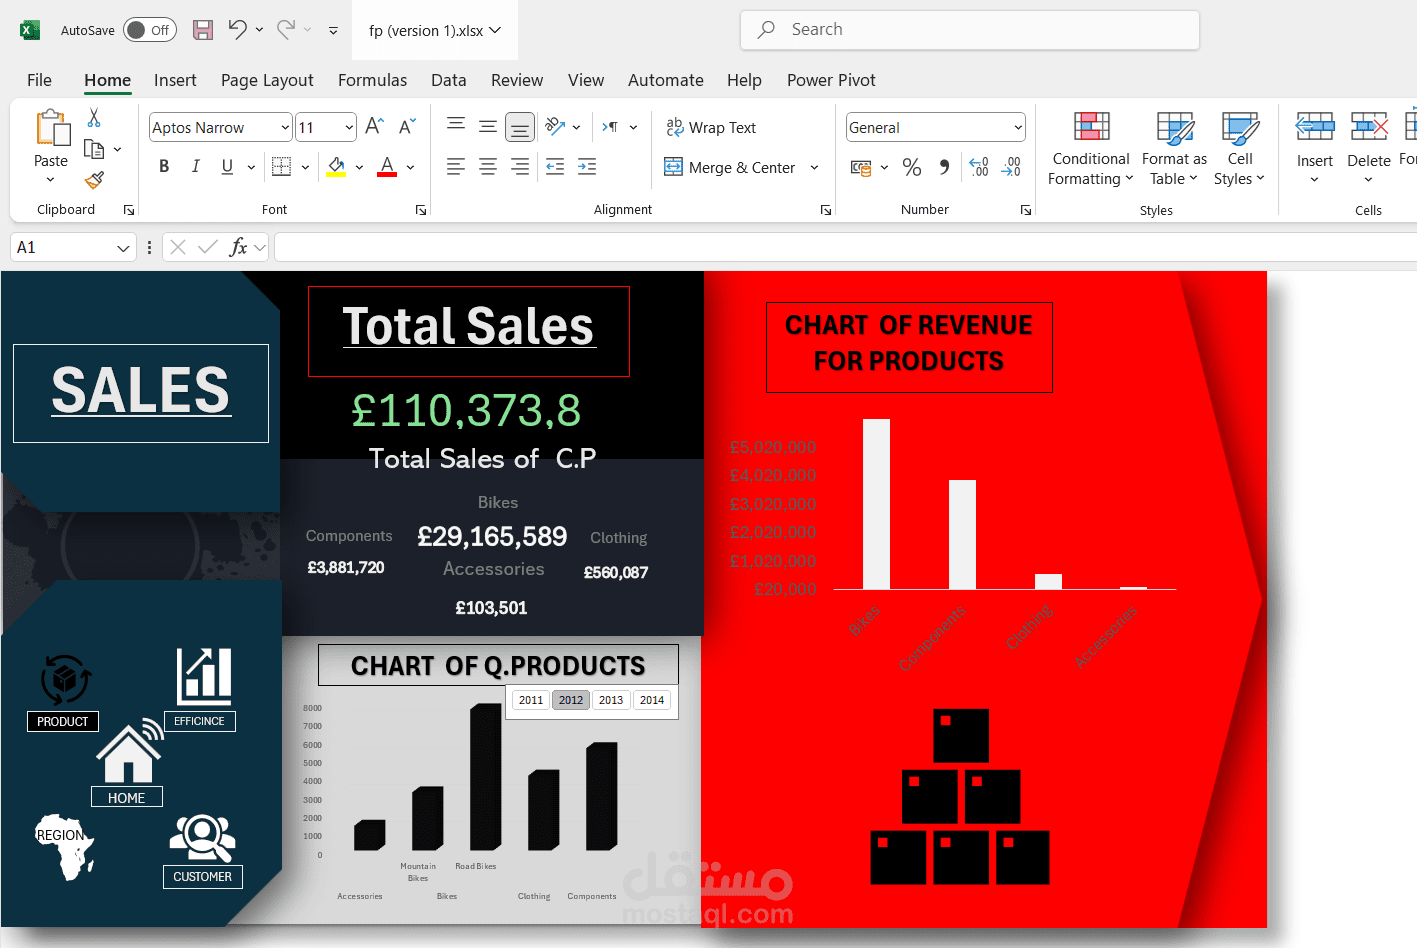
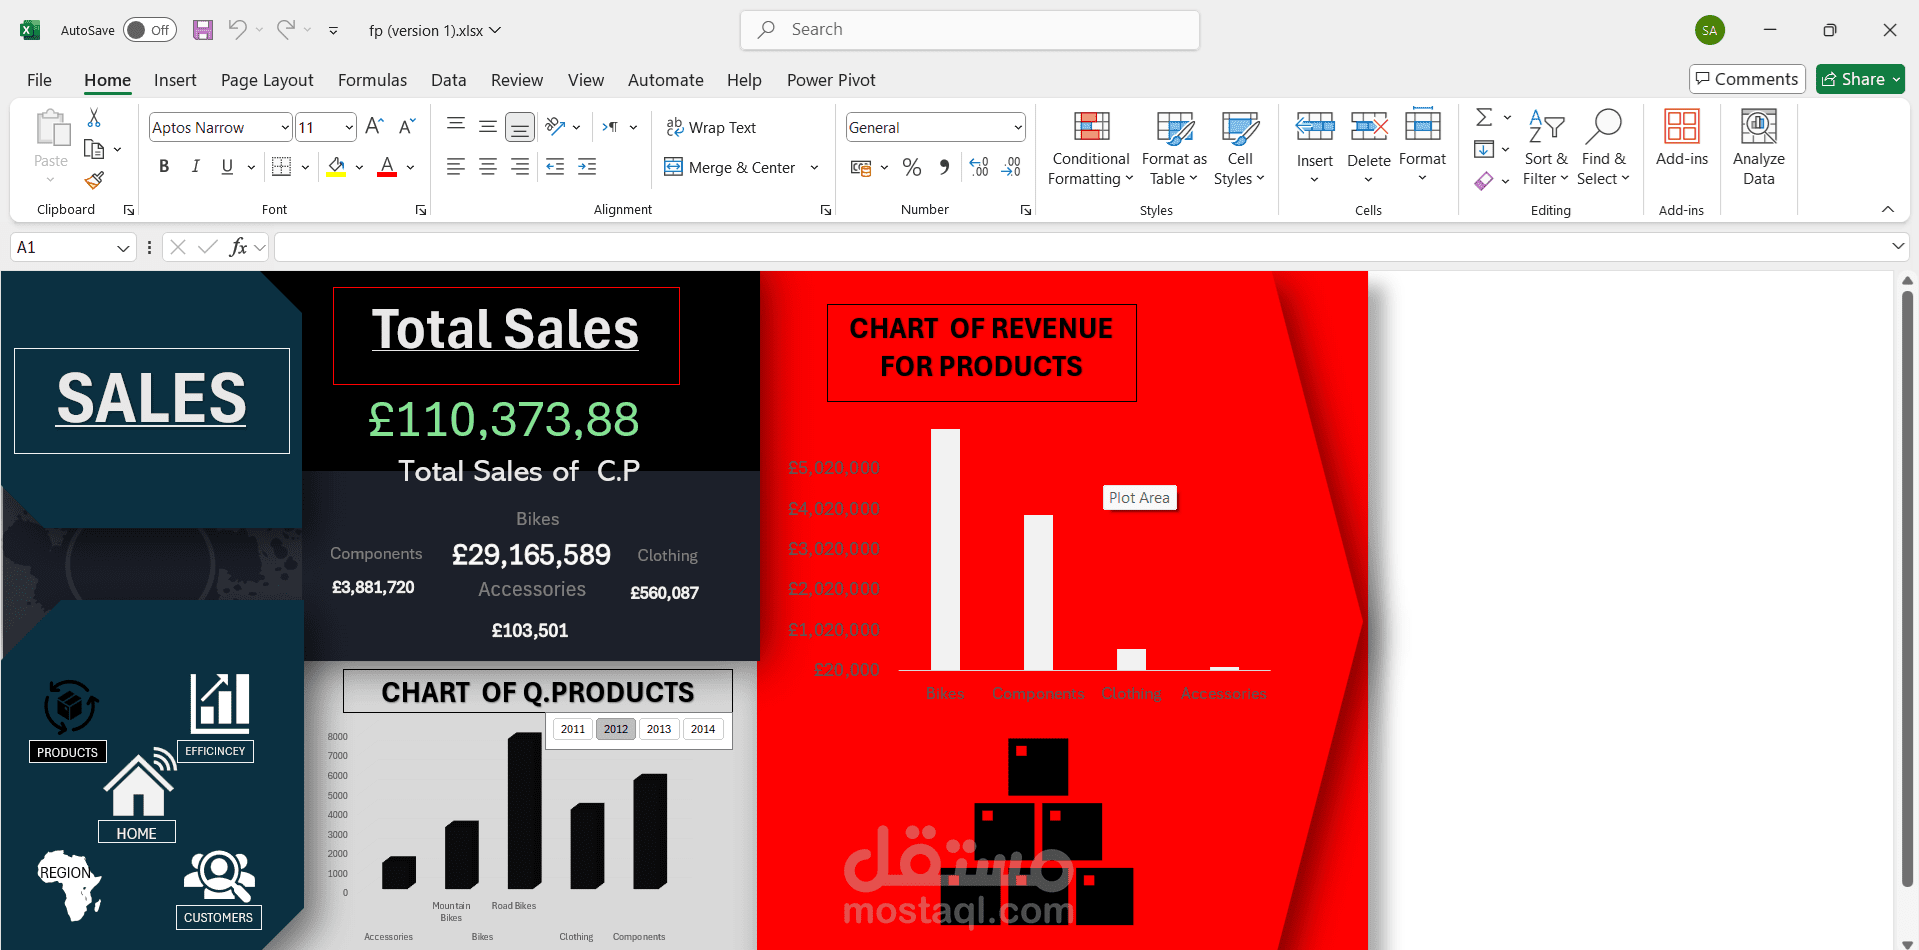
I’m excited to share the results of my journey into data visualization! This Sales Dashboard is a milestone in my data analysis career, showcasing my ability to turn raw data into actionable insights with a visually appealing and user-friendly interface.
Dashboard Highlights:
Total Sales: Achieved a remarkable 110,373,88, with the Bikes category emerging as the best-selling item, generating an outstanding 29,165,589 in sales.
Top Region: The Region Screen reveals North America as the top-performing market, contributing £18,396 in total sales.
Product Breakdown: Components brought in £3,881,720, Accessories contributed £103,501, and Clothing added £560,087.
Best Sales Feature: A dedicated section highlights Bikes as the most popular and best-selling product, reinforcing their significance to overall revenue.
What Makes This Dashboard Special?
The inclusion of Navigator Buttons allows for effortless exploration of critical metrics:
Products
Efficiency
Regions
Customers
Home Screen
These buttons make the dashboard interactive and intuitive, ensuring every stakeholder can extract the data they need at a glance.
“Great achievements are built step by step. Believe in yourself, embrace every challenge, and trust that your efforts will lead you to success!”
Thanks to Eng Aya Ayman for their exceptional mentorship throughout this journey. Your support has been invaluable, and I’m grateful for the opportunity to learn and grow under your guidance.