Sales Dashboard
تفاصيل العمل
This project involved the complete process of data cleaning, visualization, and utilizing tools using Excel.
Data Cleaning Process:
Handled missing values to ensure data accuracy.
Standardized inconsistent entries.
Prepared the data for meaningful analysis.
Visualization and Insights:
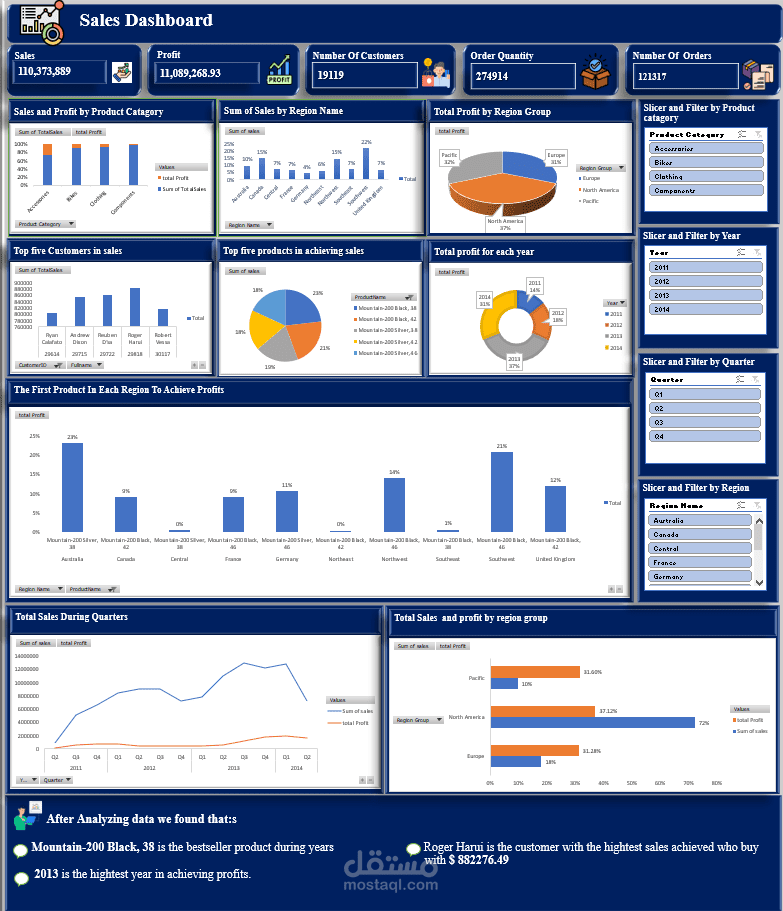
Created interactive slicers for filtering data by product category, region, year, and quarter.
Designed visualizations in Excel to explore trends in sales, profits, and customer behavior.
Identified key metrics, such as the best-performing products and regions.
Key Findings:
The Mountain-200 Black, 38 is the bestseller over the years.
Roger Harris achieved the highest sales, totaling $88,276.49.
2013 was the year with the highest profits.
This project helped me combine the power of Excel's advanced visualization and slicer functionalities with Excel to create a comprehensive, user-friendly dashboard
