Building an Interactive Training & Development Dashboard
تفاصيل العمل
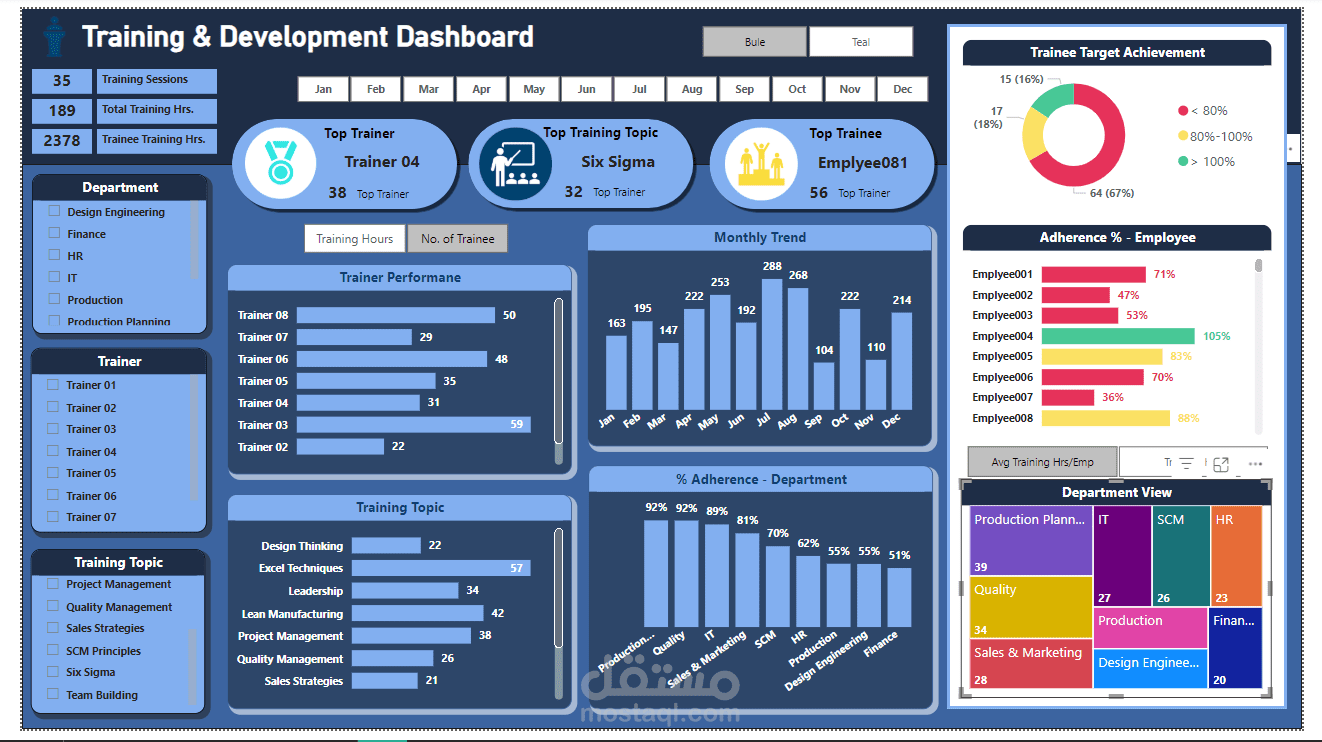


this interactive dashboard I designed using powerful tools like Excel, Power BI, Power Query, and DAX. The primary goal of this dashboard is to provide a comprehensive overview of training and development program performance within an organization.
What the Dashboard Offers:
Analysis of trainer and employee performance.
Comparison of training hours by department and topic.
Goal achievement KPIs to monitor adherence rates.
Monthly trends and performance insights.
Tools Used:
Excel: For data cleaning and preparation.
Power Query: For advanced data transformation and modeling.
Power BI: For building the dashboard and creating visualizations.
DAX: To write calculations and create interactive KPIs.
This dashboard is designed to help organizations make data-driven decisions to enhance training programs and improve overall efficiency.